$237,900
1 bd|1 ba|850 sqft
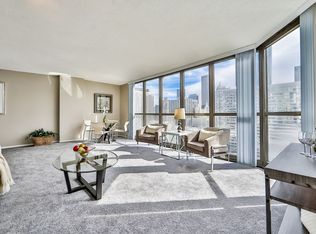
10 E Ontario St #P-M903, Chicago, IL 60611
Off Market

Zillow last checked: 7 hours ago
Listing updated: 14 hours ago
Stephanie Maloney 847-495-5000,
HomeSmart Connect LLC
$250,500
$230,000 - $271,000
$2,313/mo
| Date | Event | Price |
|---|---|---|
| 4/8/2026 | Listed for sale | $230,000+17.3%$301/sqft |
Source: | ||
| 2/7/2018 | Listing removed | $1,600$2/sqft |
Source: Urban Real Estate #09821005 Report a problem | ||
| 12/22/2017 | Price change | $1,600+3.2%$2/sqft |
Source: Urban Real Estate #09821005 Report a problem | ||
| 11/29/2017 | Price change | $1,550-3.1%$2/sqft |
Source: CC Home Realty Corp. #09713979 Report a problem | ||
| 10/17/2017 | Price change | $1,600-3%$2/sqft |
Source: CC Home Realty Corp. #09713979 Report a problem | ||
| 9/30/2017 | Price change | $1,650-2.4%$2/sqft |
Source: CC Home Realty Corp. #09713979 Report a problem | ||
| 8/28/2017 | Price change | $1,690-5.6%$2/sqft |
Source: CC Home Realty Corp. #09713979 Report a problem | ||
| 8/18/2017 | Price change | $1,790-3.2%$2/sqft |
Source: CC Home Realty Corp. #09713979 Report a problem | ||
| 8/4/2017 | Listed for rent | $1,850$2/sqft |
Source: Owner #09713979 Report a problem | ||
| 7/25/2013 | Sold | $196,000+3.2%$256/sqft |
Source: | ||
| 6/15/2013 | Pending sale | $189,900$248/sqft |
Source: Chicago Real Estate Resources #08366712 Report a problem | ||
| 6/12/2013 | Listed for sale | $189,900+28.2%$248/sqft |
Source: Chicago Real Estate Resources #08366712 Report a problem | ||
| 12/29/2009 | Sold | $148,100$194/sqft |
Source: | ||
| Year | Property taxes | Tax assessment |
|---|---|---|
| 2023 | $4,709 +2.6% | $22,319 |
| 2022 | $4,591 +2.3% | $22,319 |
| 2021 | $4,488 -3.8% | $22,319 +6.5% |
| 2020 | $4,667 +2.1% | $20,948 -7.9% |
| 2019 | $4,569 +1.7% | $22,743 |
| 2018 | $4,493 +21.4% | $22,743 +32.3% |
| 2017 | $3,702 +7.5% | $17,195 |
| 2016 | $3,444 +9.3% | $17,195 |
| 2015 | $3,151 +31.7% | $17,195 +33.3% |
| 2014 | $2,393 +2% | $12,896 |
| 2013 | $2,345 +1.4% | $12,896 |
| 2012 | $2,314 -11.6% | $12,896 -20.1% |
| 2011 | $2,617 -0.4% | $16,148 |
| 2010 | $2,628 -30.4% | $16,148 -33.3% |
| 2009 | $3,775 +1.8% | $24,209 -6.4% |
| 2008 | $3,709 -7.1% | $25,856 -8% |
| 2007 | $3,990 -1.1% | $28,097 |
| 2006 | $4,034 | $28,097 |
Source: MRED as distributed by MLS GRID. This data may not be complete. We recommend contacting the local school district to confirm school assignments for this home.