$1,618
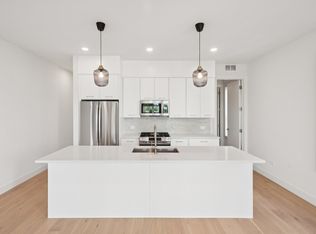
4 bd|3 ba|1.8k sqft
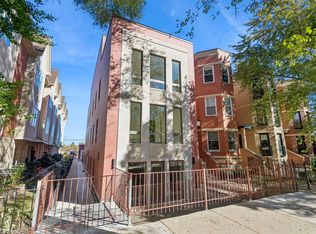
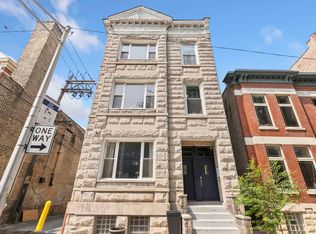
2323 N Lister Ave #1F, Chicago, IL 60614
For Rent

Zillow last checked:
Listing updated:
Linda Levin (312)320-6741,
Jameson Sotheby's Intl Realty
$2,360,900
$2.24M - $2.48M
$4,657/mo
| Date | Event | Price |
|---|---|---|
| 1/15/2026 | Price change | $2,490,000-16.7% |
Source: | ||
| 11/11/2025 | Listed for sale | $2,990,000+360% |
Source: | ||
| 3/24/2021 | Listing removed | -- |
Source: Owner Report a problem | ||
| 1/19/2021 | Sold | $650,000+6.6% |
Source: Public Record Report a problem | ||
| 11/21/2018 | Listing removed | $3,300 |
Source: Owner Report a problem | ||
| 9/15/2018 | Price change | $3,300-8.3% |
Source: Owner Report a problem | ||
| 8/28/2018 | Price change | $3,600-7.7% |
Source: Owner Report a problem | ||
| 8/16/2018 | Price change | $3,900-13.3% |
Source: Owner Report a problem | ||
| 8/15/2018 | Sold | $610,000+19.1% |
Source: Public Record Report a problem | ||
| 8/10/2018 | Listed for rent | $4,500 |
Source: Owner Report a problem | ||
| 9/5/2002 | Sold | $512,000+279.3% |
Source: Public Record Report a problem | ||
| 1/28/1998 | Sold | $135,000 |
Source: Public Record Report a problem | ||
| 5/22/1997 | Sold | $135,000+22.7% |
Source: Public Record Report a problem | ||
| 4/3/1997 | Sold | $110,000+83.3% |
Source: Public Record Report a problem | ||
| 9/25/1996 | Sold | $60,000 |
Source: Public Record Report a problem | ||
| Year | Property taxes | Tax assessment |
|---|---|---|
| 2023 | $10,984 +2.6% | $51,872 |
| 2022 | $10,706 +2.3% | $51,872 |
| 2021 | $10,465 -1% | $51,872 +9.8% |
| 2020 | $10,566 -2.4% | $47,258 -12% |
| 2019 | $10,829 +2.1% | $53,703 |
| 2018 | $10,608 +34.5% | $53,703 +46.6% |
| 2017 | $7,887 +7.5% | $36,640 |
| 2016 | $7,339 +9.3% | $36,640 |
| 2015 | $6,714 +12.3% | $36,640 +13.7% |
| 2014 | $5,979 +2% | $32,224 |
| 2013 | $5,861 +1.4% | $32,224 |
| 2012 | $5,783 -8.5% | $32,224 -17.4% |
| 2011 | $6,321 -0.4% | $39,009 |
| 2010 | $6,348 +4.4% | $39,009 |
| 2009 | $6,083 +2.5% | $39,009 -5.7% |
| 2008 | $5,936 +1% | $41,384 |
| 2007 | $5,878 -1.1% | $41,384 |
| 2006 | $5,941 +36.3% | $41,384 +55.1% |
| 2005 | $4,360 +1% | $26,682 |
| 2004 | $4,316 +2.2% | $26,682 |
| 2003 | $4,222 +36.7% | $26,682 +55.2% |
| 2002 | $3,088 +3.7% | $17,188 |
| 2001 | $2,976 +0.8% | $17,188 |
| 2000 | $2,952 -0.7% | $17,188 +11.9% |
| 1999 | $2,971 | $15,364 |
Source: MRED as distributed by MLS GRID. This data may not be complete. We recommend contacting the local school district to confirm school assignments for this home.
A local agent can set up tours, give advice and negotiate with sellers.
A local lender can help you make sure your offer is ready when you are.