$550,700
3 bd|2 ba|1.7k sqft
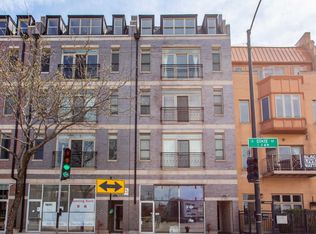
1845 S State St APT 4, Chicago, IL 60616
Off Market
Zillow last checked:
Listing updated:
Renee Greene 312-286-9101,
Compass
$429,400
$408,000 - $451,000
$3,673/mo
| Date | Event | Price |
|---|---|---|
| 5/20/2026 | Listing removed | $430,000+3.6%$292/sqft |
Source: | ||
| 8/11/2022 | Sold | $415,000-2.4%$281/sqft |
Source: | ||
| 7/15/2022 | Pending sale | $425,000$288/sqft |
Source: | ||
| 7/7/2022 | Price change | $425,000-0.6%$288/sqft |
Source: | ||
| 6/28/2022 | Price change | $427,500-0.6%$290/sqft |
Source: | ||
| 6/21/2022 | Price change | $430,000-0.6%$292/sqft |
Source: | ||
| 6/16/2022 | Price change | $432,500-0.6%$293/sqft |
Source: | ||
| 5/13/2022 | Price change | $435,000-2.2%$295/sqft |
Source: | ||
| 5/3/2022 | Price change | $445,000-1.1%$302/sqft |
Source: | ||
| 4/4/2022 | Listed for sale | $450,000+8.4%$305/sqft |
Source: | ||
| 12/12/2020 | Listing removed | $2,599$2/sqft |
Source: @properties #10822728 Report a problem | ||
| 11/30/2020 | Price change | $2,5990%$2/sqft |
Source: @properties #10822728 Report a problem | ||
| 9/23/2020 | Price change | $2,600-3.7%$2/sqft |
Source: @properties #10822728 Report a problem | ||
| 8/27/2020 | Price change | $2,700-3.6%$2/sqft |
Source: @properties #10822728 Report a problem | ||
| 8/18/2020 | Price change | $2,800+5.7%$2/sqft |
Source: @properties #10822728 Report a problem | ||
| 8/6/2020 | Price change | $2,650-5.4%$2/sqft |
Source: Publix Realty Inc. #10807013 Report a problem | ||
| 7/5/2020 | Price change | $2,800-6.5%$2/sqft |
Source: Publix Realty Inc. #10748624 Report a problem | ||
| 5/29/2020 | Price change | $2,995-3.4%$2/sqft |
Source: Publix Realty Inc. #10718110 Report a problem | ||
| 4/14/2020 | Listed for rent | $3,100$2/sqft |
Source: Publix Realty Inc. #10689890 Report a problem | ||
| 3/8/2017 | Sold | $415,000+6.4%$281/sqft |
Source: | ||
| 2/27/2015 | Sold | $390,000$264/sqft |
Source: Public Record Report a problem | ||
| Year | Property taxes | Tax assessment |
|---|---|---|
| 2023 | $6,350 +2.6% | $29,998 |
| 2022 | $6,189 +2.3% | $29,998 |
| 2021 | $6,050 -28.7% | $29,998 -21.3% |
| 2020 | $8,491 +6.5% | $38,115 -3.9% |
| 2019 | $7,972 +1.7% | $39,680 |
| 2018 | $7,838 -8.2% | $39,680 +0% |
| 2017 | $8,538 +7.5% | $39,664 |
| 2016 | $7,944 +9.3% | $39,664 |
| 2015 | $7,268 | $39,664 |
Source: MRED as distributed by MLS GRID. This data may not be complete. We recommend contacting the local school district to confirm school assignments for this home.
A local agent can set up tours, give advice and negotiate with sellers.
A local lender can help you make sure your offer is ready when you are.