$109,300
2 bd|1 ba|1k sqft
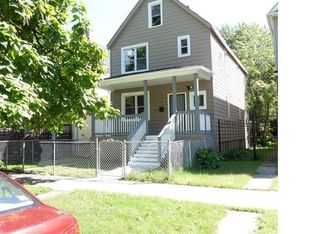
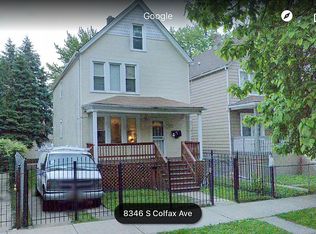
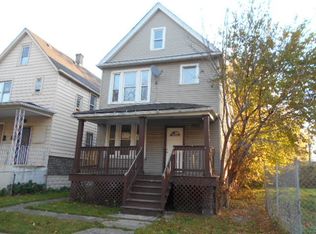
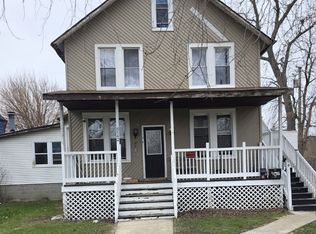
8349 S Colfax Ave #2, Chicago, IL 60617
Off Market
Zillow last checked: 7 hours ago
Listing updated: April 01, 2026 at 05:15pm
Zeeshan Bhimji 886-267-4220,
Real Property Management Group Chicago
Not available
Estimated sales range
Not available
Not available
| Date | Event | Price |
|---|---|---|
| 4/2/2026 | Listed for sale | $299,999+100% |
Source: | ||
| 12/31/2024 | Sold | $150,000-5.7% |
Source: | ||
| 10/15/2024 | Contingent | $159,000 |
Source: | ||
| 6/19/2024 | Listed for sale | $159,000-11.2% |
Source: | ||
| 4/29/2024 | Listing removed | -- |
Source: | ||
| 2/1/2024 | Listed for sale | $179,000 |
Source: | ||
| 1/11/2024 | Listing removed | -- |
Source: | ||
| 1/4/2024 | Listed for sale | $179,000 |
Source: | ||
| 1/4/2024 | Listing removed | -- |
Source: | ||
| 9/5/2023 | Listed for sale | $179,000 |
Source: | ||
| 8/24/2023 | Pending sale | $179,000 |
Source: | ||
| 11/18/2022 | Price change | $179,000-3.2% |
Source: | ||
| 9/6/2022 | Price change | $184,900-2.6% |
Source: | ||
| 7/5/2022 | Listed for sale | $189,900+27% |
Source: | ||
| 7/2/2021 | Listing removed | -- |
Source: Zillow Rental Network_1 Report a problem | ||
| 6/16/2021 | Listed for rent | $1,100+12.8% |
Source: Zillow Rental Network_1 Report a problem | ||
| 4/13/2019 | Listing removed | $975 |
Source: Zillow Rental Manager Report a problem | ||
| 2/12/2019 | Listed for rent | $975-15.2% |
Source: Zillow Rental Manager Report a problem | ||
| 1/5/2019 | Listing removed | $1,150 |
Source: Zillow Rental Manager Report a problem | ||
| 10/31/2018 | Sold | $149,500-9.4% |
Source: Public Record Report a problem | ||
| 10/24/2018 | Listed for rent | $1,150 |
Source: Zillow Rental Manager Report a problem | ||
| 6/23/2017 | Listing removed | $165,000 |
Source: RE/MAX Suburban #09576792 Report a problem | ||
| 6/12/2017 | Price change | $165,000+26.9% |
Source: RE/MAX Suburban #09576792 Report a problem | ||
| 3/27/2017 | Listed for sale | $130,000+766.7% |
Source: RE/MAX Suburban #09576792 Report a problem | ||
| 6/1/2015 | Sold | $15,000-88.6% |
Source: Public Record Report a problem | ||
| 2/4/2009 | Sold | $132,000+230% |
Source: Public Record Report a problem | ||
| 6/18/2008 | Sold | $40,000-85.2% |
Source: | ||
| 12/15/2006 | Sold | $270,000 |
Source: Public Record Report a problem | ||
| Year | Property taxes | Tax assessment |
|---|---|---|
| 2023 | $3,165 +2.6% | $15,000 |
| 2022 | $3,085 +2.3% | $15,000 |
| 2021 | $3,016 +69.1% | $15,000 +87.3% |
| 2020 | $1,784 +107.7% | $8,007 +87.3% |
| 2019 | $859 +1.7% | $4,274 |
| 2018 | $844 -9.3% | $4,274 -1.2% |
| 2017 | $931 -63.9% | $4,326 -66.4% |
| 2016 | $2,582 +9.3% | $12,893 |
| 2015 | $2,363 +17.9% | $12,893 +19.4% |
| 2014 | $2,003 +2% | $10,798 |
| 2013 | $1,964 +1.4% | $10,798 |
| 2012 | $1,938 -12% | $10,798 -20.5% |
| 2011 | $2,201 -0.4% | $13,581 |
| 2010 | $2,210 +4.4% | $13,581 |
| 2009 | $2,118 -5.3% | $13,581 -12.9% |
| 2008 | $2,236 +1% | $15,590 |
| 2007 | $2,214 -1.1% | $15,590 |
| 2006 | $2,238 +142.1% | $15,590 +81.4% |
| 2005 | $925 +1.9% | $8,595 |
| 2004 | $907 +4.5% | $8,595 |
| 2003 | $869 -5.4% | $8,595 +24% |
| 2002 | $918 +8% | $6,934 |
| 2001 | $850 +36.6% | $6,934 |
| 2000 | $623 +1.4% | $6,934 +32.3% |
| 1999 | $614 | $5,241 |
Source: MRED as distributed by MLS GRID. This data may not be complete. We recommend contacting the local school district to confirm school assignments for this home.