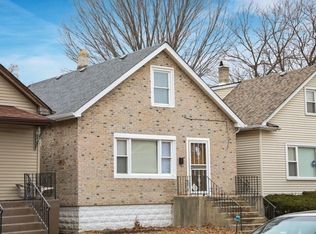
$104,400
3 bd|1 ba|960 sqft
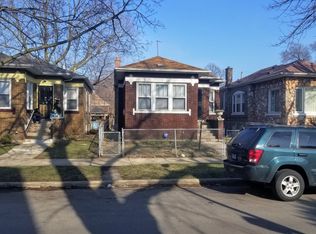
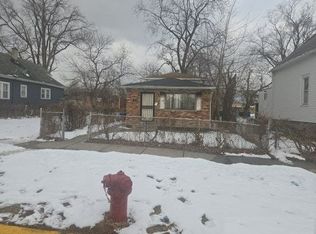
8204 S Saginaw Ave, Chicago, IL 60617
Off Market
Zillow last checked: 7 hours ago
Listing updated: March 15, 2026 at 10:07pm
Damaris Santiago 773-992-6189,
Manage Chicago, Inc.,
Chris Amatore,
Manage Chicago, Inc.
Not available
Estimated sales range
Not available
Not available
| Date | Event | Price |
|---|---|---|
| 3/10/2026 | Price change | $110,000-4.3%$76/sqft |
Source: | ||
| 1/21/2026 | Price change | $115,000-4.2%$80/sqft |
Source: | ||
| 12/31/2025 | Listed for sale | $120,000+669.2%$83/sqft |
Source: | ||
| 3/22/2020 | Listing removed | $1,800$1/sqft |
Source: Go Section8 Report a problem | ||
| 2/22/2020 | Listed for rent | $1,800+2.9%$1/sqft |
Source: Go Section8 Report a problem | ||
| 1/14/2019 | Listing removed | $1,750$1/sqft |
Source: Go Section8 Report a problem | ||
| 12/18/2018 | Listed for rent | $1,750+25%$1/sqft |
Source: Go Section8 Report a problem | ||
| 2/16/2015 | Listing removed | $1,400$1/sqft |
Source: Go Section8 Report a problem | ||
| 11/20/2014 | Listed for rent | $1,400$1/sqft |
Source: Go Section8 Report a problem | ||
| 10/20/2014 | Listing removed | $1,400$1/sqft |
Source: Go Section8 Report a problem | ||
| 1/29/2014 | Listed for rent | $1,400$1/sqft |
Source: Go Section8 Report a problem | ||
| 11/15/2013 | Listing removed | $1,400$1/sqft |
Source: Go Section8 Report a problem | ||
| 10/22/2013 | Price change | $1,400+75%$1/sqft |
Source: MANAGE CHICAGO Report a problem | ||
| 10/20/2013 | Price change | $800-42.9%$1/sqft |
Source: Postlets Report a problem | ||
| 3/1/2013 | Listed for rent | $1,400$1/sqft |
Source: Manage Chicago, Inc Report a problem | ||
| 2/26/2013 | Sold | $15,600+0.6%$11/sqft |
Source: | ||
| 1/3/2013 | Listed for sale | $15,500-87%$11/sqft |
Source: RE/MAX Synergy #08241523 Report a problem | ||
| 9/15/2004 | Sold | $119,000+133.3%$83/sqft |
Source: Public Record Report a problem | ||
| 2/6/2004 | Sold | $51,000$35/sqft |
Source: Public Record Report a problem | ||
| Year | Property taxes | Tax assessment |
|---|---|---|
| 2023 | $1,371 +2.6% | $6,500 |
| 2022 | $1,337 +2.3% | $6,500 |
| 2021 | $1,307 -30.6% | $6,500 -23.1% |
| 2020 | $1,884 -0.2% | $8,455 -10% |
| 2019 | $1,888 +1.7% | $9,395 |
| 2018 | $1,856 -9.4% | $9,395 -1.3% |
| 2017 | $2,049 +7.5% | $9,520 |
| 2016 | $1,907 +9.3% | $9,520 |
| 2015 | $1,744 +13.6% | $9,520 +15% |
| 2014 | $1,535 +2% | $8,275 |
| 2013 | $1,505 +1.4% | $8,275 |
| 2012 | $1,485 -14.1% | $8,275 -22.4% |
| 2011 | $1,728 -0.4% | $10,663 |
| 2010 | $1,735 +4.4% | $10,663 |
| 2009 | $1,663 +0.5% | $10,663 -7.5% |
| 2008 | $1,654 +1% | $11,532 |
| 2007 | $1,638 -1.1% | $11,532 |
| 2006 | $1,656 +31.7% | $11,532 +49.9% |
| 2005 | $1,257 +1% | $7,692 |
| 2004 | $1,244 +2.2% | $7,692 |
| 2003 | $1,217 +5.8% | $7,692 +20.1% |
| 2002 | $1,150 +51.7% | $6,402 |
| 2001 | $758 +38.6% | $6,402 |
| 2000 | $547 +1.6% | $6,402 +32.1% |
| 1999 | $538 | $4,847 |
Source: MRED as distributed by MLS GRID. This data may not be complete. We recommend contacting the local school district to confirm school assignments for this home.