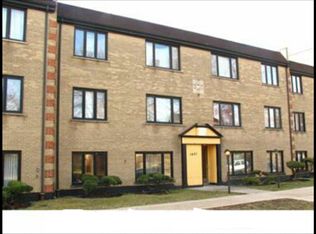
$166,700
2 bd1 ba864 sqft
8901 S Cornell Ave, Chicago, IL 60617
Off Market
Listing description withheld by the listing agent.
Zillow last checked:
Listing updated:
Anthony Kirkland (773)802-4144,
Coldwell Banker Realty

Not available
Estimated sales range
Not available
Not available
| Date | Event | Price |
|---|---|---|
| 4/8/2025 | Sold | $285,000-1%$171/sqft |
Source:  MRED as distributed by MLS GRID #12292375 Report a problem | ||
| 3/15/2025 | Contingent | $288,000+2.9%$173/sqft |
Source: MRED as distributed by MLS GRID #12292375 Report a problem | ||
| 3/5/2025 | Listed for sale | $279,900$168/sqft |
Source: MRED as distributed by MLS GRID #12292375 Report a problem | ||
| 2/26/2025 | Contingent | $279,900$168/sqft |
Source: MRED as distributed by MLS GRID #12292375 Report a problem | ||
| 2/17/2025 | Listed for sale | $279,900-1.8%$168/sqft |
Source: MRED as distributed by MLS GRID #12292375 Report a problem | ||
| 2/12/2025 | Listing removed | $285,000$171/sqft |
Source: MRED as distributed by MLS GRID #12274604 Report a problem | ||
| 1/21/2025 | Listed for sale | $285,000$171/sqft |
Source: MRED as distributed by MLS GRID #12274604 Report a problem | ||
| 1/14/2025 | Listing removed | $285,000$171/sqft |
Source: MRED as distributed by MLS GRID #12221455 Report a problem | ||
| 12/5/2024 | Listed for sale | $285,000$171/sqft |
Source: MRED as distributed by MLS GRID #12221455 Report a problem | ||
| 11/26/2024 | Listing removed | $285,000$171/sqft |
Source: MRED as distributed by MLS GRID #12214555 Report a problem | ||
| 11/21/2024 | Listed for sale | $285,000-5%$171/sqft |
Source: MRED as distributed by MLS GRID #12214555 Report a problem | ||
| 11/11/2024 | Listing removed | $299,900$180/sqft |
Source: MRED as distributed by MLS GRID #12166719 Report a problem | ||
| 10/21/2024 | Price change | $299,900-3.2%$180/sqft |
Source: MRED as distributed by MLS GRID #12166719 Report a problem | ||
| 9/27/2024 | Listed for sale | $309,900+37.1%$186/sqft |
Source: MRED as distributed by MLS GRID #12166719 Report a problem | ||
| 8/5/2020 | Sold | $226,000-1.7%$136/sqft |
Source: MRED as distributed by MLS GRID #10746471 Report a problem | ||
| 6/24/2020 | Pending sale | $229,900$138/sqft |
Source: Citywide Realty LLC #10746471 Report a problem | ||
| 6/13/2020 | Listed for sale | $229,900+474.7%$138/sqft |
Source: Citywide Realty LLC #10746471 Report a problem | ||
| 10/28/2019 | Sold | $40,000$24/sqft |
Source: Public Record Report a problem | ||
| Year | Property taxes | Tax assessment |
|---|---|---|
| 2024 | $2,559 -4.6% | $16,000 +0% |
| 2023 | $2,683 +3.4% | $15,999 |
| 2022 | $2,595 +1.6% | $15,999 |
| 2021 | $2,555 +0.9% | $15,999 +41.1% |
| 2020 | $2,533 +39.2% | $11,342 -9% |
| 2019 | $1,820 +1.8% | $12,464 |
| 2018 | $1,788 +9.4% | $12,464 +13.8% |
| 2017 | $1,634 -3.7% | $10,951 |
| 2016 | $1,697 +10.9% | $10,951 |
| 2015 | $1,530 +0.5% | $10,951 +1.8% |
| 2014 | $1,523 +2.8% | $10,756 |
| 2013 | $1,482 -0.3% | $10,756 |
| 2012 | $1,486 -13.1% | $10,756 -15.2% |
| 2011 | $1,710 +18.4% | $12,689 |
| 2010 | $1,444 +14% | $12,689 |
| 2009 | $1,267 +2.8% | $12,689 -8% |
| 2008 | $1,232 +3.3% | $13,795 |
| 2007 | $1,193 +0.8% | $13,795 |
| 2006 | $1,184 -5.2% | $13,795 +35.3% |
| 2005 | $1,249 +1.9% | $10,196 |
| 2004 | $1,226 +4.4% | $10,196 |
| 2003 | $1,173 -5.4% | $10,196 +17% |
| 2002 | $1,240 -18% | $8,714 |
| 2001 | $1,512 +28.3% | $8,714 |
| 2000 | $1,178 +0.4% | $8,714 +7.2% |
| 1999 | $1,174 | $8,125 |
Source: MRED as distributed by MLS GRID. This data may not be complete. We recommend contacting the local school district to confirm school assignments for this home.