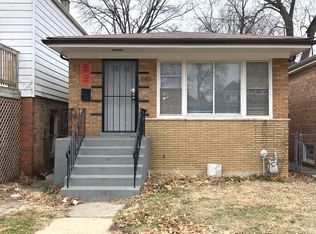
$32,000
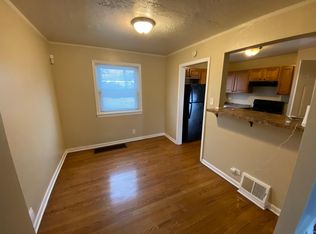
2 bd|1 ba|952 sqft
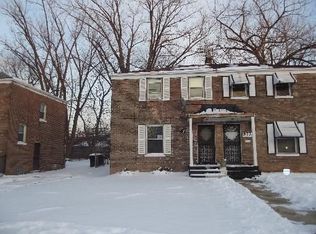
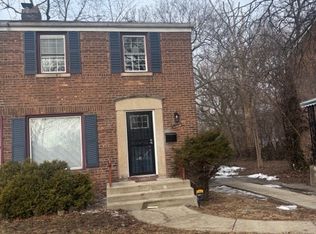
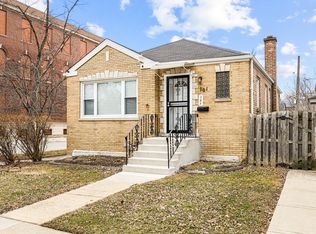
9737 S Merrill Ave, Chicago, IL 60617
Sold
Zillow last checked: 8 hours ago
Listing updated: 12 hours ago
Sundeep Lamba 630-290-1735,
Publix Realty, Inc.
$209,900
$199,000 - $220,000
$1,802/mo
| Date | Event | Price |
|---|---|---|
| 3/5/2026 | Listed for sale | $209,000+5%$221/sqft |
Source: | ||
| 10/1/2025 | Listing removed | $199,000$210/sqft |
Source: | ||
| 9/29/2025 | Price change | $199,000+2.1%$210/sqft |
Source: | ||
| 9/24/2025 | Pending sale | $195,000$206/sqft |
Source: | ||
| 9/10/2025 | Price change | $195,000-2%$206/sqft |
Source: | ||
| 9/4/2025 | Price change | $199,000-0.5%$210/sqft |
Source: | ||
| 8/25/2025 | Price change | $199,995-2.2%$211/sqft |
Source: | ||
| 8/20/2025 | Listed for sale | $204,495+188%$216/sqft |
Source: | ||
| 12/12/2024 | Sold | $71,000-16.5%$75/sqft |
Source: | ||
| 10/21/2024 | Contingent | $85,000$90/sqft |
Source: | ||
| 10/21/2024 | Listed for sale | $85,000$90/sqft |
Source: | ||
| 10/18/2024 | Pending sale | $85,000$90/sqft |
Source: | ||
| 10/16/2024 | Listed for sale | $85,000-15%$90/sqft |
Source: | ||
| 8/17/2024 | Listing removed | $100,000$106/sqft |
Source: | ||
| 8/12/2024 | Pending sale | $100,000$106/sqft |
Source: | ||
| 7/30/2024 | Price change | $100,000-4.7%$106/sqft |
Source: | ||
| 7/23/2024 | Price change | $104,900-4.5%$111/sqft |
Source: | ||
| 7/16/2024 | Listed for sale | $109,900+29.3%$116/sqft |
Source: | ||
| 5/9/2024 | Listing removed | -- |
Source: | ||
| 2/6/2024 | Listed for sale | $85,000-5.6%$90/sqft |
Source: | ||
| 10/26/2022 | Listed for rent | $1,500$2/sqft |
Source: Zillow Rental Network_1 Report a problem | ||
| 4/13/2021 | Sold | $90,000+5.9%$95/sqft |
Source: | ||
| 3/8/2021 | Contingent | $85,000$90/sqft |
Source: | ||
| 2/19/2021 | Listed for sale | $85,000$90/sqft |
Source: | ||
| 2/19/2021 | Listing removed | -- |
Source: | ||
| 1/29/2021 | Listed for sale | $85,000$90/sqft |
Source: | ||
| 1/29/2021 | Listing removed | -- |
Source: | ||
| Year | Property taxes | Tax assessment |
|---|---|---|
| 2023 | $1,269 +2.5% | $5,999 |
| 2022 | $1,238 +2.3% | $5,999 |
| 2021 | $1,210 -25.9% | $5,999 -17.9% |
| 2020 | $1,632 -0.2% | $7,308 -10% |
| 2019 | $1,636 +1.7% | $8,120 |
| 2018 | $1,608 +2.1% | $8,120 +11.2% |
| 2017 | $1,575 -0.5% | $7,300 -7.4% |
| 2016 | $1,583 +9.3% | $7,886 |
| 2015 | $1,449 +9.8% | $7,886 +11.1% |
| 2014 | $1,320 +2% | $7,095 |
| 2013 | $1,293 +1.4% | $7,095 |
| 2012 | $1,276 +76.6% | $7,095 -26% |
| 2011 | $723 -9.1% | $9,582 |
| 2010 | $795 +14% | $9,582 |
| 2009 | $697 +2.8% | $9,582 +3.5% |
| 2008 | $678 +3.3% | $9,262 |
| 2007 | $657 +0.8% | $9,262 |
| 2006 | $652 -5.2% | $9,262 +49.6% |
| 2005 | $687 +1.9% | $6,191 |
| 2004 | $675 +4.4% | $6,191 |
| 2003 | $646 +48.4% | $6,191 +10.2% |
| 2002 | $435 -30.2% | $5,616 |
| 2001 | $623 +20.4% | $5,616 |
| 2000 | $517 | $5,616 +19.8% |
| 1999 | -- | $4,689 |
Source: MRED as distributed by MLS GRID. This data may not be complete. We recommend contacting the local school district to confirm school assignments for this home.