$608,400
2 bd|1 ba|900 sqft
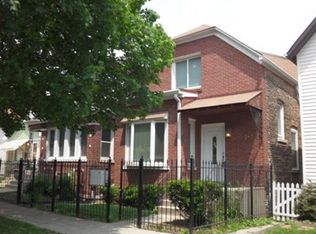
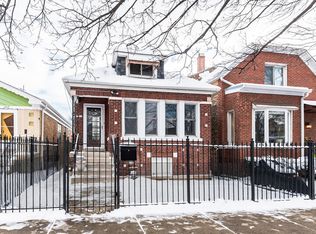
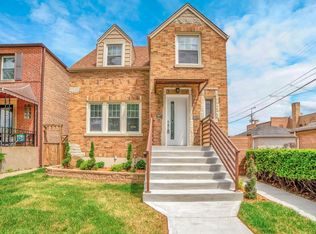
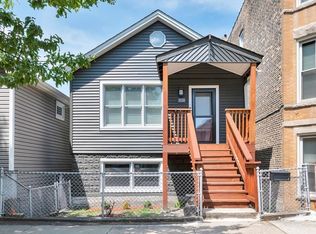
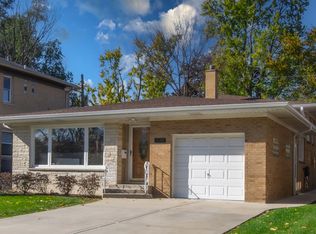
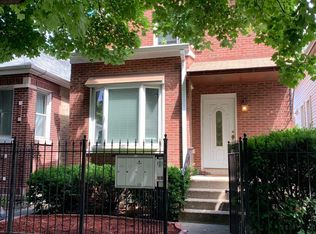
2949 N Washtenaw Ave, Chicago, IL 60618
Off Market
Zillow last checked: 8 hours ago
Listing updated: February 23, 2026 at 09:48am
Stephanie Sullivan 773-991-9359,
Baird & Warner
Not available
Estimated sales range
Not available
Not available
| Date | Event | Price |
|---|---|---|
| 2/23/2026 | Listed for sale | $600,000+27.7%$333/sqft |
Source: | ||
| 11/10/2016 | Sold | $470,000-2.1%$261/sqft |
Source: | ||
| 9/15/2016 | Pending sale | $480,000$267/sqft |
Source: Dream Town Realty #09336865 Report a problem | ||
| 9/9/2016 | Listed for sale | $480,000+38.3%$267/sqft |
Source: Dream Town Realty #09336865 Report a problem | ||
| 12/7/2009 | Sold | $347,000-11%$193/sqft |
Source: | ||
| 6/30/2009 | Listing removed | $389,900$217/sqft |
Source: Berg Properties #07162119 Report a problem | ||
| 6/20/2009 | Price change | $389,900-1.3%$217/sqft |
Source: Berg Properties #07162119 Report a problem | ||
| 5/16/2009 | Price change | $394,900-1.2%$219/sqft |
Source: Homes.com #07162119 Report a problem | ||
| 3/29/2009 | Price change | $399,8000%$222/sqft |
Source: Homes.com #07162119 Report a problem | ||
| 3/22/2009 | Listed for sale | $399,900+37%$222/sqft |
Source: Homes.com #07162119 Report a problem | ||
| 6/27/2005 | Sold | $292,000$162/sqft |
Source: Agent Provided Report a problem | ||
| Year | Property taxes | Tax assessment |
|---|---|---|
| 2023 | $8,191 +2.9% | $42,000 |
| 2022 | $7,962 +2.1% | $42,000 |
| 2021 | $7,802 +19.8% | $42,000 +30.3% |
| 2020 | $6,513 +1% | $32,234 -9% |
| 2019 | $6,451 +2.1% | $35,423 |
| 2018 | $6,319 +15.5% | $35,423 +23% |
| 2017 | $5,471 +3.9% | $28,789 |
| 2016 | $5,266 +9.8% | $28,789 |
| 2015 | $4,795 -0.7% | $28,789 +0.7% |
| 2014 | $4,828 +2.3% | $28,590 |
| 2013 | $4,722 +0.8% | $28,590 |
| 2012 | $4,683 -1.5% | $28,590 -8.8% |
| 2011 | $4,752 +4.6% | $31,347 |
| 2010 | $4,541 -7.1% | $31,347 |
| 2009 | $4,888 +18.1% | $31,347 +8.6% |
| 2008 | $4,139 -4.3% | $28,853 -5.2% |
| 2007 | $4,323 -1.1% | $30,439 |
| 2006 | $4,370 +25.6% | $30,439 +42.9% |
| 2005 | $3,480 +59% | $21,299 |
| 2004 | $2,189 +5.1% | $21,299 |
| 2003 | $2,084 -5.1% | $21,299 +51.7% |
| 2002 | $2,195 +5.5% | $14,041 |
| 2001 | $2,081 +29.6% | $14,041 |
| 2000 | $1,606 +0.1% | $14,041 +35.6% |
| 1999 | $1,604 | $10,358 |
Source: MRED as distributed by MLS GRID. This data may not be complete. We recommend contacting the local school district to confirm school assignments for this home.