$65,300
-- bd|-- ba|-- sqft
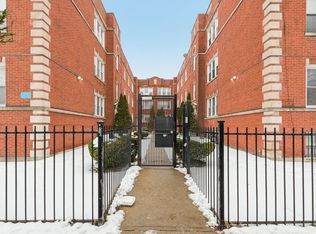
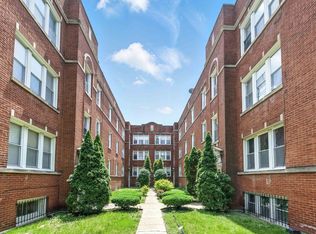
801 E 87th Pl APT 1, Chicago, IL 60619
Off Market
Zillow last checked:
Listing updated:
Craig Lane (312)813-7049,
RE/MAX Premier
$89,400
$75,000 - $105,000
$1,457/mo
| Date | Event | Price |
|---|---|---|
| 5/23/2026 | Listed for sale | $69,999+12.9%$76/sqft |
Source: MRED as distributed by MLS GRID #12656884 Report a problem | ||
| 3/29/2024 | Sold | $62,000-4.6%$67/sqft |
Source: | ||
| 2/12/2024 | Contingent | $65,000$71/sqft |
Source: | ||
| 2/12/2024 | Listed for sale | $65,000$71/sqft |
Source: | ||
| 1/9/2024 | Contingent | $65,000$71/sqft |
Source: | ||
| 12/28/2023 | Listed for sale | $65,000$71/sqft |
Source: | ||
| 12/18/2023 | Contingent | $65,000$71/sqft |
Source: | ||
| 12/12/2023 | Price change | $65,000-9.1%$71/sqft |
Source: | ||
| 12/6/2023 | Price change | $71,500-0.7%$78/sqft |
Source: | ||
| 12/1/2023 | Price change | $72,000-0.7%$78/sqft |
Source: | ||
| 11/13/2023 | Price change | $72,500-3.3%$79/sqft |
Source: | ||
| 11/6/2023 | Listed for sale | $75,000+50.3%$81/sqft |
Source: | ||
| 6/8/2023 | Listing removed | -- |
Source: | ||
| 12/29/2022 | Listed for sale | $49,900$54/sqft |
Source: | ||
| 11/29/2022 | Listing removed | $49,900$54/sqft |
Source: | ||
| 11/6/2022 | Listed for sale | $49,900+72.1%$54/sqft |
Source: | ||
| 7/11/2019 | Sold | $29,000-12.1%$31/sqft |
Source: Public Record Report a problem | ||
| 6/5/2019 | Pending sale | $33,000$36/sqft |
Source: Real People Realty Inc. #10343000 Report a problem | ||
| 5/29/2019 | Listed for sale | $33,000$36/sqft |
Source: Real People Realty Inc. #10343000 Report a problem | ||
| 4/20/2019 | Pending sale | $33,000$36/sqft |
Source: Real People Realty Inc. #10343000 Report a problem | ||
| 4/13/2019 | Listed for sale | $33,000-15.4%$36/sqft |
Source: Real People Realty Inc. #10343000 Report a problem | ||
| 7/7/2017 | Listing removed | $1,000$1/sqft |
Source: Ideal Real Estate, LLC Report a problem | ||
| 6/25/2017 | Listing removed | $39,000$42/sqft |
Source: Ideal Real Estate LLC #09499421 Report a problem | ||
| 6/15/2017 | Listed for rent | $1,000$1/sqft |
Source: Ideal Real Estate, LLC Report a problem | ||
| 1/15/2017 | Listed for sale | $39,000$42/sqft |
Source: Ideal Real Estate LLC #09285629 Report a problem | ||
| 11/16/2016 | Pending sale | $39,000+143.8%$42/sqft |
Source: Ideal Real Estate LLC #09285629 Report a problem | ||
| 12/14/2009 | Sold | $16,000-77.8%$17/sqft |
Source: | ||
| 5/26/2006 | Sold | $72,000$78/sqft |
Source: Public Record Report a problem | ||
| Year | Property taxes | Tax assessment |
|---|---|---|
| 2023 | $392 +3.4% | $1,499 |
| 2022 | $379 +1.5% | $1,499 |
| 2021 | $373 -81.7% | $1,499 -80.2% |
| 2020 | $2,040 -0.1% | $7,569 -10.1% |
| 2019 | $2,042 +1.3% | $8,417 |
| 2018 | $2,015 -0.6% | $8,417 +6.4% |
| 2017 | $2,027 +7.1% | $7,913 |
| 2016 | $1,894 +8% | $7,913 |
| 2015 | $1,753 +17.7% | $7,913 +19.4% |
| 2014 | $1,490 +2% | $6,630 |
| 2013 | $1,460 +2.5% | $6,630 |
| 2012 | $1,425 +19.9% | $6,630 +11% |
| 2011 | $1,188 -4.9% | $5,971 |
| 2010 | $1,249 +34.2% | $5,971 |
| 2009 | $931 -19.5% | $5,971 -26% |
| 2008 | $1,157 +1% | $8,068 |
| 2007 | $1,146 -1.1% | $8,068 |
| 2006 | $1,158 +141% | $8,068 +63.8% |
| 2005 | $481 +1.9% | $4,926 |
| 2004 | $472 +4.5% | $4,926 |
| 2003 | $451 -5.4% | $4,926 +10% |
| 2002 | $477 +12.2% | $4,479 |
| 2001 | $425 -2.3% | $4,479 |
| 2000 | $435 +0% | $4,479 +5% |
| 1999 | $435 | $4,265 |
Source: MRED as distributed by MLS GRID. This data may not be complete. We recommend contacting the local school district to confirm school assignments for this home.
A local agent can set up tours, give advice and negotiate with sellers.