$106,200
3 bd|1 ba|891 sqft
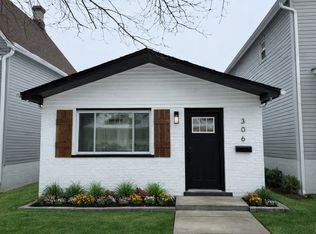
8837 S Wabash Ave, Chicago, IL 60619
Off Market
Zillow last checked: 7 hours ago
Listing updated: February 12, 2026 at 04:06pm
Justin Harmon 773-701-2121,
Infiniti Properties, Inc.
Not available
Estimated sales range
Not available
Not available
| Date | Event | Price |
|---|---|---|
| 2/13/2026 | Contingent | $240,000$200/sqft |
Source: | ||
| 1/30/2026 | Price change | $240,000-7.3%$200/sqft |
Source: | ||
| 12/3/2025 | Price change | $259,000-7.5%$216/sqft |
Source: | ||
| 11/21/2025 | Listed for sale | $280,000+7.7%$233/sqft |
Source: | ||
| 9/2/2025 | Listing removed | $259,900$217/sqft |
Source: | ||
| 6/3/2025 | Listed for sale | $259,900$217/sqft |
Source: | ||
| 4/28/2025 | Contingent | $259,900$217/sqft |
Source: | ||
| 3/28/2025 | Listed for sale | $259,900$217/sqft |
Source: | ||
| 3/27/2025 | Listing removed | $259,900$217/sqft |
Source: | ||
| 2/25/2025 | Price change | $259,900-3.7%$217/sqft |
Source: | ||
| 11/24/2024 | Price change | $269,900-3.2%$225/sqft |
Source: | ||
| 10/27/2024 | Price change | $278,900-2.1%$232/sqft |
Source: | ||
| 10/25/2024 | Listed for sale | $285,000-3.7%$238/sqft |
Source: | ||
| 8/17/2024 | Listing removed | $296,000$247/sqft |
Source: | ||
| 6/3/2024 | Listed for sale | $296,000+2.1%$247/sqft |
Source: | ||
| 5/8/2024 | Listing removed | -- |
Source: | ||
| 5/5/2024 | Listed for sale | $290,000+314.3%$242/sqft |
Source: | ||
| 6/26/2023 | Sold | $70,000-6.7%$58/sqft |
Source: | ||
| 4/12/2023 | Contingent | $75,000$63/sqft |
Source: | ||
| 4/7/2023 | Listed for sale | $75,000$63/sqft |
Source: | ||
| Year | Property taxes | Tax assessment |
|---|---|---|
| 2023 | $1,798 +2.5% | $8,500 |
| 2022 | $1,753 +2.3% | $8,500 |
| 2021 | $1,714 -36.9% | $8,500 -30.1% |
| 2020 | $2,716 +0.9% | $12,160 -9% |
| 2019 | $2,692 +1.7% | $13,363 |
| 2018 | $2,646 +117.8% | $13,363 +14.1% |
| 2017 | $1,215 -18.5% | $11,708 |
| 2016 | $1,491 +39.1% | $11,708 |
| 2015 | $1,072 +0.9% | $11,708 +15.7% |
| 2014 | $1,063 +3.9% | $10,119 |
| 2013 | $1,023 -2.6% | $10,119 |
| 2012 | $1,051 -30.4% | $10,119 -20.1% |
| 2011 | $1,510 +18.8% | $12,664 |
| 2010 | $1,271 +15.3% | $12,664 |
| 2009 | $1,103 +4% | $12,664 -2.5% |
| 2008 | $1,060 +2.1% | $12,984 |
| 2007 | $1,038 +2% | $12,984 |
| 2006 | $1,018 -6.6% | $12,984 +16.5% |
| 2005 | $1,090 +3.1% | $11,147 |
| 2004 | $1,058 +2.5% | $11,147 |
| 2003 | $1,032 -35% | $11,147 +26.2% |
| 2002 | $1,589 +34.6% | $8,831 |
| 2001 | $1,181 +14% | $8,831 |
| 2000 | $1,036 +0.6% | $8,831 +19.6% |
| 1999 | $1,030 | $7,384 |
Find assessor info on the county website
Source: MRED as distributed by MLS GRID. This data may not be complete. We recommend contacting the local school district to confirm school assignments for this home.