$233,500
2 bd|1 ba|900 sqft
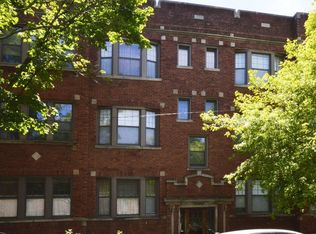
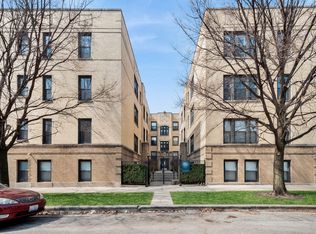
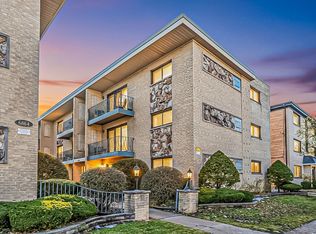
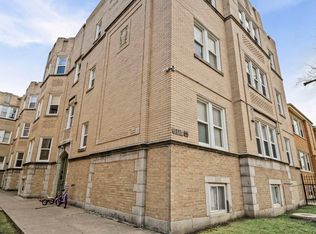
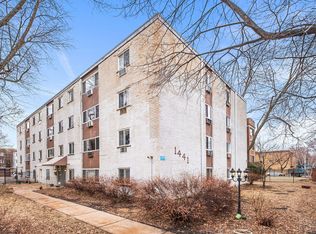
1545 W Arthur Ave #2D, Chicago, IL 60626
Off Market
Zillow last checked: 7 hours ago
Listing updated: 18 hours ago
Morgan Sage 312-944-8900,
Berkshire Hathaway HomeServices Chicago,
Christian Chacon,
Berkshire Hathaway HomeServices Chicago
$251,300
$231,000 - $274,000
$1,840/mo
| Date | Event | Price |
|---|---|---|
| 3/31/2026 | Listed for sale | $265,000+43.2%$389/sqft |
Source: | ||
| 5/3/2022 | Sold | $185,000-4.4%$271/sqft |
Source: Public Record Report a problem | ||
| 2/5/2013 | Listing removed | $1,200$2/sqft |
Source: Prudential Rubloff #08243059 Report a problem | ||
| 12/15/2012 | Price change | $1,200-4%$2/sqft |
Source: Keller Williams Preferred Realty #08185430 Report a problem | ||
| 11/7/2012 | Price change | $1,250-3.5%$2/sqft |
Source: Keller Williams Preferred Realty #08185430 Report a problem | ||
| 10/30/2012 | Price change | $1,295-2.3%$2/sqft |
Source: Keller Williams Preferred Realty #08185430 Report a problem | ||
| 10/24/2012 | Listed for rent | $1,325$2/sqft |
Source: Keller Williams Preferred Realty #08185430 Report a problem | ||
| 5/16/2010 | Listing removed | $193,500$284/sqft |
Source: SPECTRUM Real Estate Group, LLC Report a problem | ||
| 4/3/2010 | Listed for sale | $193,500+6.3%$284/sqft |
Source: SPECTRUM Real Estate Group, LLC Report a problem | ||
| 6/7/2006 | Sold | $182,000$267/sqft |
Source: Public Record Report a problem | ||
| Year | Property taxes | Tax assessment |
|---|---|---|
| 2023 | $3,291 +31.4% | $15,599 |
| 2022 | $2,505 +1.5% | $15,599 |
| 2021 | $2,467 +25.1% | $15,599 +30.5% |
| 2020 | $1,971 -2.5% | $11,952 -11.4% |
| 2019 | $2,021 +1.8% | $13,490 |
| 2018 | $1,986 -15.3% | $13,490 -5.4% |
| 2017 | $2,344 -0.5% | $14,263 |
| 2016 | $2,357 +10.5% | $14,263 |
| 2015 | $2,133 +57.9% | $14,263 +44.8% |
| 2014 | $1,351 +2.9% | $9,850 |
| 2013 | $1,313 -0.5% | $9,850 |
| 2012 | $1,320 -48.1% | $9,850 -44.4% |
| 2011 | $2,545 -11.8% | $17,727 |
| 2010 | $2,885 +4.4% | $17,727 |
| 2009 | $2,764 +16% | $17,727 +6.7% |
| 2008 | $2,383 +1% | $16,615 |
| 2007 | $2,360 -1.1% | $16,615 |
| 2006 | $2,385 -5.5% | $16,615 -3.8% |
| 2005 | $2,523 -9.7% | $17,273 |
| 2004 | $2,794 +2.2% | $17,273 |
| 2003 | $2,733 | $17,273 |
Source: MRED as distributed by MLS GRID. This data may not be complete. We recommend contacting the local school district to confirm school assignments for this home.