$577,700
4 bd|2 ba|2.4k sqft
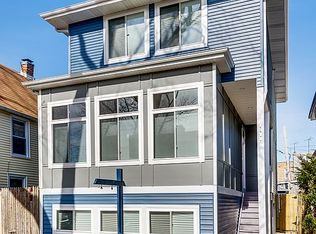
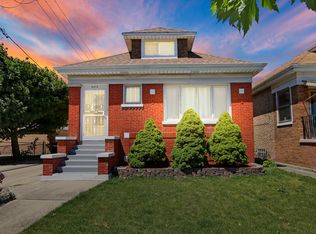
4620 N Kostner Ave, Chicago, IL 60630
Off Market
Zillow last checked: 8 hours ago
Listing updated: February 13, 2026 at 01:08am
Mark Ahmad 773-983-1553,
Century 21 Circle,
Imad Ahmad,
Century 21 Circle
$616,500
$586,000 - $647,000
$3,901/mo
| Date | Event | Price |
|---|---|---|
| 2/18/2026 | Listed for rent | $4,200$2/sqft |
Source: Zillow Rentals Report a problem | ||
| 2/18/2026 | Listing removed | $4,200$2/sqft |
Source: MRED as distributed by MLS GRID #12567081 Report a problem | ||
| 2/13/2026 | Listed for rent | $4,200$2/sqft |
Source: MRED as distributed by MLS GRID #12567081 Report a problem | ||
| 1/28/2026 | Price change | $629,000-3.1%$315/sqft |
Source: | ||
| 1/5/2026 | Listed for sale | $649,000-4.4%$325/sqft |
Source: | ||
| 9/16/2025 | Listing removed | $679,000$340/sqft |
Source: | ||
| 6/13/2025 | Price change | $679,000-2.9%$340/sqft |
Source: | ||
| 5/23/2025 | Price change | $699,000-4.1%$350/sqft |
Source: | ||
| 4/16/2025 | Listed for sale | $729,000-2.7%$365/sqft |
Source: | ||
| 4/16/2025 | Listing removed | $749,000$375/sqft |
Source: | ||
| 2/6/2025 | Listed for sale | $749,000+240.5%$375/sqft |
Source: | ||
| 3/21/2024 | Sold | $220,000$110/sqft |
Source: Public Record Report a problem | ||
| Year | Property taxes | Tax assessment |
|---|---|---|
| 2023 | $3,959 +3.2% | $22,000 |
| 2022 | $3,837 +1.8% | $22,000 |
| 2021 | $3,769 -26.3% | $22,000 -15.3% |
| 2020 | $5,115 -0.3% | $25,970 -10% |
| 2019 | $5,129 +1.7% | $28,856 |
| 2018 | $5,041 +24.8% | $28,856 +30.8% |
| 2017 | $4,038 +2.6% | $22,060 |
| 2016 | $3,934 +10% | $22,060 |
| 2015 | $3,576 +9.1% | $22,060 +9.4% |
| 2014 | $3,279 +2.4% | $20,166 |
| 2013 | $3,203 +0.9% | $20,166 |
| 2012 | $3,173 -7.8% | $20,166 -20.2% |
| 2011 | $3,443 +3.5% | $25,270 |
| 2010 | $3,326 +10.2% | $25,270 |
| 2009 | $3,018 +0.2% | $25,270 -8.7% |
| 2008 | $3,012 +14.2% | $27,693 |
| 2007 | $2,637 +41.7% | $27,693 |
| 2006 | $1,861 -7.4% | $27,693 +41.3% |
| 2005 | $2,009 +4.4% | $19,605 |
| 2004 | $1,925 +4.4% | $19,605 |
| 2003 | $1,843 -5.4% | $19,605 +54.9% |
| 2002 | $1,949 -11.3% | $12,659 |
| 2001 | $2,196 +27.6% | $12,659 |
| 2000 | $1,721 +0.1% | $12,659 +15.7% |
| 1999 | $1,720 | $10,942 |
Source: MRED as distributed by MLS GRID. This data may not be complete. We recommend contacting the local school district to confirm school assignments for this home.