$128,200
1 bd|1 ba|-- sqft
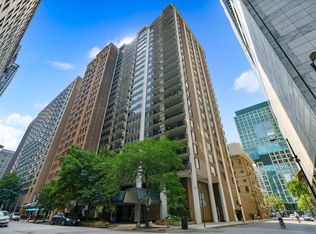
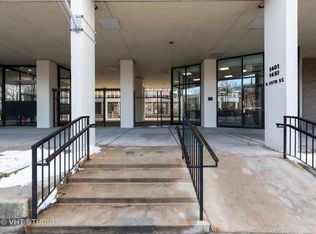
1401 E 55th St APT 309N, Chicago, IL 60615
Off Market
Zillow last checked: 7 hours ago
Listing updated: 10 hours ago
Chris Stockwell 773-793-4102,
Compass,
Chris Laubach 773-793-4103,
Compass
Not available
Estimated sales range
Not available
Not available
| Date | Event | Price |
|---|---|---|
| 3/16/2026 | Listed for sale | $250,000+5.9%$267/sqft |
Source: | ||
| 10/17/2024 | Sold | $236,000-1.7%$252/sqft |
Source: | ||
| 10/5/2024 | Pending sale | $240,000$256/sqft |
Source: | ||
| 9/24/2024 | Contingent | $240,000$256/sqft |
Source: | ||
| 9/11/2024 | Listed for sale | $240,000+29.7%$256/sqft |
Source: | ||
| 11/20/2020 | Sold | $185,000+68.2%$198/sqft |
Source: | ||
| 1/4/2018 | Listing removed | $1,700$2/sqft |
Source: 5i5j Realty Co. Ltd. #09809115 Report a problem | ||
| 10/5/2017 | Listed for rent | $1,700-10.5%$2/sqft |
Source: Zillow Rental Manager #09809115 Report a problem | ||
| 8/16/2017 | Listing removed | $1,900$2/sqft |
Source: Zillow Rental Network Report a problem | ||
| 8/6/2017 | Listed for rent | $1,900$2/sqft |
Source: Zillow Rental Network Report a problem | ||
| 8/1/2014 | Sold | $110,000$118/sqft |
Source: Berkshire Hathaway HomeServices Koenig Rubloff #08510859_60637_1029S Report a problem | ||
| Year | Property taxes | Tax assessment |
|---|---|---|
| 2023 | $3,176 +2.9% | $14,999 |
| 2022 | $3,085 +2.3% | $14,999 |
| 2021 | $3,016 +24.8% | $14,999 +38.2% |
| 2020 | $2,417 +1.8% | $10,851 -8.2% |
| 2019 | $2,374 +1.7% | $11,817 |
| 2018 | $2,334 +1.4% | $11,817 +10.5% |
| 2017 | $2,301 +7.5% | $10,691 |
| 2016 | $2,141 +9.3% | $10,691 |
| 2015 | $1,959 -19.3% | $10,691 -18.3% |
| 2014 | $2,428 +2% | $13,084 |
| 2013 | $2,380 +1.4% | $13,084 |
| 2012 | $2,348 +3.9% | $13,084 -6.2% |
| 2011 | $2,260 -0.4% | $13,949 |
| 2010 | $2,270 +0.2% | $13,949 -4% |
| 2009 | $2,266 +17.2% | $14,531 +7.8% |
| 2008 | $1,934 +1% | $13,479 |
| 2007 | $1,914 -1.1% | $13,479 |
| 2006 | $1,935 +33.3% | $13,479 +51.7% |
| 2005 | $1,452 +1% | $8,886 |
| 2004 | $1,437 +2.2% | $8,886 |
| 2003 | $1,406 +25.7% | $8,886 +42.7% |
| 2002 | $1,118 +3.8% | $6,225 |
| 2001 | $1,078 +38.7% | $6,225 |
| 2000 | $777 -33.5% | $6,225 +3% |
| 1999 | $1,169 | $6,046 |
Source: MRED as distributed by MLS GRID. This data may not be complete. We recommend contacting the local school district to confirm school assignments for this home.