$370,700
2 bd|2 ba|1.2k sqft
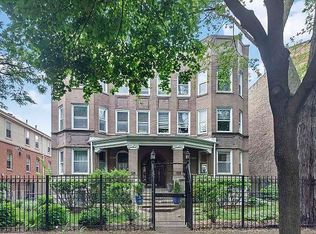
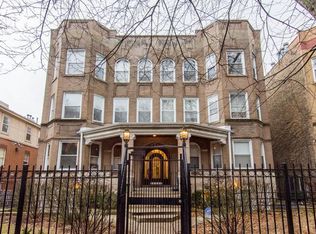
4718 N Kenmore Ave #G, Chicago, IL 60640
Off Market
Zillow last checked: 7 hours ago
Listing updated: 10 hours ago
Mark Zipperer (773)612-6628,
RE/MAX Premier
$469,600
$446,000 - $493,000
$3,011/mo
| Date | Event | Price |
|---|---|---|
| 4/8/2026 | Listed for sale | $475,000+147.4%$352/sqft |
Source: | ||
| 11/16/2012 | Sold | $192,000+7.3%$142/sqft |
Source: | ||
| 1/20/2012 | Listing removed | $179,000$133/sqft |
Source: NCI #07957323 Report a problem | ||
| 12/23/2011 | Price change | $179,000-5.7%$133/sqft |
Source: NCI #07957323 Report a problem | ||
| 12/17/2011 | Listed for sale | $189,900+15.1%$141/sqft |
Source: NCI #07957323 Report a problem | ||
| 10/29/2011 | Listing removed | $165,000$122/sqft |
Source: Coldwell Banker Residential Brokerage - Lincoln Park Plaza #07679411 Report a problem | ||
| 7/27/2011 | Price change | $165,000-5.7%$122/sqft |
Source: Coldwell Banker Residential Brokerage - Lincoln Park Plaza #07679411 Report a problem | ||
| 3/13/2011 | Listed for sale | $175,000$130/sqft |
Source: Coldwell Banker Residential Brokerage - Lincoln Park Plaza #07679411 Report a problem | ||
| 1/21/2011 | Listing removed | $175,000$130/sqft |
Source: NRT Chicago #07679411 Report a problem | ||
| 12/11/2010 | Price change | $175,000-12.1%$130/sqft |
Source: NRT Chicago #07679411 Report a problem | ||
| 11/20/2010 | Listed for sale | $199,000-22%$147/sqft |
Source: NRT Chicago #07679411 Report a problem | ||
| 4/5/2001 | Sold | $255,000$189/sqft |
Source: Public Record Report a problem | ||
| Year | Property taxes | Tax assessment |
|---|---|---|
| 2023 | $6,135 +3% | $32,391 |
| 2022 | $5,959 +2% | $32,391 |
| 2021 | $5,844 +23.7% | $32,391 +33.2% |
| 2020 | $4,725 -0.6% | $24,313 -10.2% |
| 2019 | $4,751 +8.2% | $27,078 |
| 2018 | $4,389 +26.1% | $27,078 +38.6% |
| 2017 | $3,480 -1.2% | $19,543 |
| 2016 | $3,524 +9.9% | $19,543 |
| 2015 | $3,207 +45.7% | $19,543 +38.8% |
| 2014 | $2,200 +5.7% | $14,075 |
| 2013 | $2,082 +0.2% | $14,075 |
| 2012 | $2,078 -8% | $14,075 -11.8% |
| 2011 | $2,259 -1.8% | $15,961 |
| 2010 | $2,301 +4.1% | $15,961 |
| 2009 | $2,211 -25% | $15,961 -41.4% |
| 2008 | $2,949 +3.2% | $27,219 |
| 2007 | $2,858 +0.8% | $27,219 |
| 2006 | $2,835 -5.1% | $27,219 +12.3% |
| 2005 | $2,989 +1.9% | $24,236 |
| 2004 | $2,933 +4.5% | $24,236 |
| 2003 | $2,808 -5.4% | $24,236 +32.1% |
| 2002 | $2,969 -6.6% | $18,347 |
| 2001 | $3,177 | $18,347 |
| 2000 | -- | $18,347 |
Source: MRED as distributed by MLS GRID. This data may not be complete. We recommend contacting the local school district to confirm school assignments for this home.