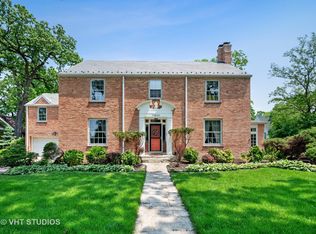
$655,300
4 bd|3 ba|3k sqft
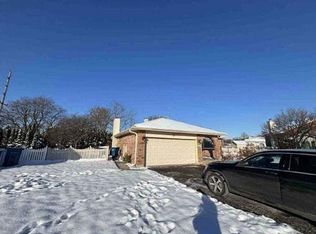
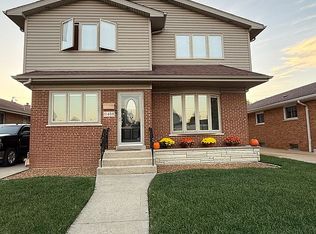
10559 S Seeley Ave, Chicago, IL 60643
Off Market
Zillow last checked: 7 hours ago
Listing updated: March 11, 2026 at 09:15am
Thomas Segers 708-361-0800,
Century 21 Circle
Not available
Estimated sales range
Not available
Not available
| Date | Event | Price |
|---|---|---|
| 3/4/2026 | Price change | $599,900-4.8%$202/sqft |
Source: | ||
| 1/22/2026 | Price change | $629,999-3.1%$212/sqft |
Source: | ||
| 12/18/2025 | Listed for sale | $650,000+44.4%$219/sqft |
Source: | ||
| 8/22/2016 | Sold | $450,000-6.1%$152/sqft |
Source: | ||
| 7/8/2016 | Pending sale | $479,000$161/sqft |
Source: Berkshire Hathaway HomeServices KoenigRubloff Realty Group #09172901 Report a problem | ||
| 3/22/2016 | Listed for sale | $479,000-4.2%$161/sqft |
Source: Berkshire Hathaway HomeServices KoenigRubloff Realty Group #09172901 Report a problem | ||
| 1/19/2016 | Listing removed | $499,999$169/sqft |
Source: Titcomb Realty P.C. #08979388 Report a problem | ||
| 11/17/2015 | Price change | $499,999-3.8%$169/sqft |
Source: Titcomb Realty P.C. #08979388 Report a problem | ||
| 8/27/2015 | Price change | $519,999-4.6%$175/sqft |
Source: Titcomb Realty P.C. #08979388 Report a problem | ||
| 8/6/2015 | Price change | $545,000-2.7%$184/sqft |
Source: Titcomb Realty P.C. #08979388 Report a problem | ||
| 7/11/2015 | Listed for sale | $560,000$189/sqft |
Source: Titcomb Realty P.C. #08979388 Report a problem | ||
| Year | Property taxes | Tax assessment |
|---|---|---|
| 2023 | $9,874 +2.8% | $50,000 |
| 2022 | $9,609 +2.1% | $50,000 |
| 2021 | $9,411 +0.7% | $50,000 +11.2% |
| 2020 | $9,344 +2.1% | $44,946 -8% |
| 2019 | $9,150 +1.7% | $48,855 |
| 2018 | $8,994 -15.5% | $48,855 -1% |
| 2017 | $10,649 +7.5% | $49,359 |
| 2016 | $9,910 +20.2% | $49,359 |
| 2015 | $8,241 +17.1% | $49,359 +16.9% |
| 2014 | $7,035 +2.3% | $42,227 |
| 2013 | $6,876 -9.5% | $42,227 |
| 2012 | $7,594 +23.2% | $42,227 +2.2% |
| 2011 | $6,162 -8.5% | $41,307 |
| 2010 | $6,735 +17.5% | $41,307 -5.7% |
| 2009 | $5,731 -10.7% | $43,803 -16.9% |
| 2008 | $6,419 +6.6% | $52,718 |
| 2007 | $6,021 +8.8% | $52,718 |
| 2006 | $5,534 +7.8% | $52,718 +33.6% |
| 2005 | $5,132 +2.1% | $39,465 |
| 2004 | $5,025 +0.7% | $39,465 |
| 2003 | $4,992 -5.4% | $39,465 +26.8% |
| 2002 | $5,274 +4.4% | $31,136 |
| 2001 | $5,050 -4.2% | $31,136 |
| 2000 | $5,271 -0.4% | $31,136 +5.9% |
| 1999 | $5,294 | $29,399 |
Source: MRED as distributed by MLS GRID. This data may not be complete. We recommend contacting the local school district to confirm school assignments for this home.