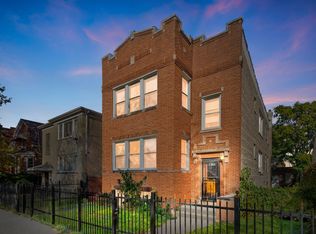
$561,600
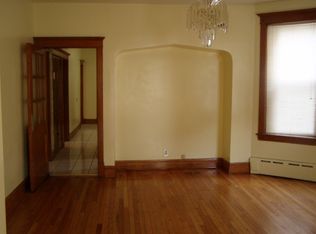
3 bd|1 ba|1.3k sqft
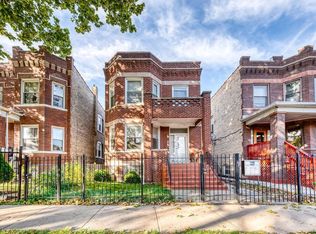
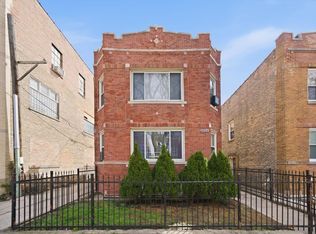
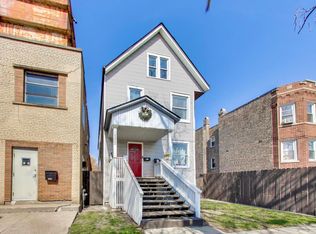
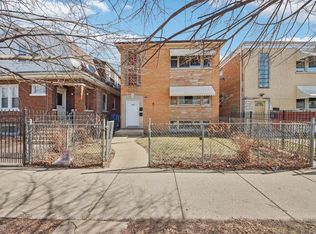
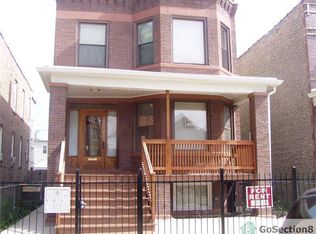
4224 W Kamerling Ave #2, Chicago, IL 60651
Off Market
Zillow last checked:
Listing updated:
Percy Crudup 773-252-0600,
North Clybourn Group, Inc.
Not available
Estimated sales range
Not available
Not available
| Date | Event | Price |
|---|---|---|
| 4/14/2026 | Listed for sale | $520,000+10.6% |
Source: | ||
| 11/3/2025 | Listing removed | $470,000 |
Source: | ||
| 8/5/2025 | Contingent | $470,000 |
Source: | ||
| 8/3/2025 | Listed for sale | $470,000 |
Source: | ||
| 7/26/2025 | Contingent | $470,000 |
Source: | ||
| 7/22/2025 | Listed for sale | $470,000+14.6% |
Source: | ||
| 12/27/2016 | Listing removed | $1,275+6.3% |
Source: Go Section8 Report a problem | ||
| 11/9/2012 | Listing removed | $1,200 |
Source: Perdure Carter Report a problem | ||
| 10/25/2012 | Listed for rent | $1,200 |
Source: Perdure Carter Report a problem | ||
| 4/5/2006 | Sold | $410,000+86.4% |
Source: Public Record Report a problem | ||
| 1/18/2005 | Sold | $220,000+61.8% |
Source: Public Record Report a problem | ||
| 8/12/1999 | Sold | $136,000+70% |
Source: Public Record Report a problem | ||
| 7/1/1999 | Sold | $80,000 |
Source: Public Record Report a problem | ||
| Year | Property taxes | Tax assessment |
|---|---|---|
| 2023 | $7,128 +3.2% | $36,999 |
| 2022 | $6,907 +2% | $36,999 |
| 2021 | $6,770 +63.9% | $36,999 +70.9% |
| 2020 | $4,132 -5.4% | $21,650 -14% |
| 2019 | $4,369 +1.7% | $25,175 |
| 2018 | $4,294 +11.8% | $25,175 +18.6% |
| 2017 | $3,842 +2.4% | $21,224 |
| 2016 | $3,751 +10% | $21,224 |
| 2015 | $3,409 +16.3% | $21,224 +15.6% |
| 2014 | $2,931 +2.4% | $18,364 |
| 2013 | $2,862 +0.5% | $18,364 |
| 2012 | $2,848 -17.6% | $18,364 -21.3% |
| 2011 | $3,456 -4% | $23,344 -7.1% |
| 2010 | $3,598 +14% | $25,140 -1.9% |
| 2009 | $3,155 -0.5% | $25,632 -11.1% |
| 2008 | $3,171 -0.9% | $28,822 -9% |
| 2007 | $3,199 -29.6% | $31,669 |
| 2006 | $4,546 +33.3% | $31,669 +51.7% |
| 2005 | $3,410 +1% | $20,872 |
| 2004 | $3,376 +2.2% | $20,872 |
| 2003 | $3,303 +27.3% | $20,872 +44.6% |
| 2002 | $2,594 +20.7% | $14,437 |
| 2001 | $2,150 -6.1% | $14,437 |
| 2000 | $2,288 +150.8% | $14,437 +21.2% |
| 1999 | $912 | $11,911 |
Source: MRED as distributed by MLS GRID. This data may not be complete. We recommend contacting the local school district to confirm school assignments for this home.
A local agent can set up tours, give advice and negotiate with sellers.