$407,700
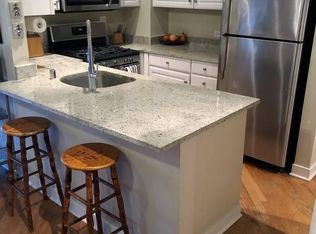
1 bd|2 ba|1k sqft
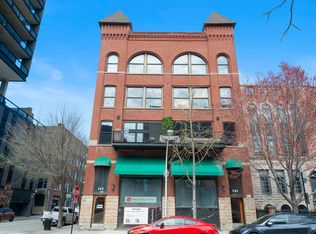
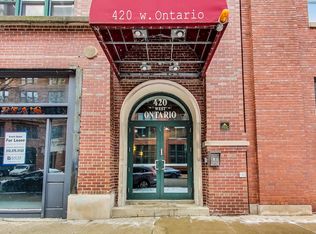
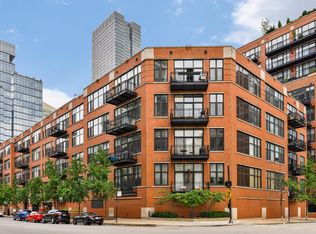
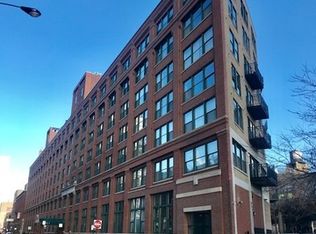
411 W Ontario St APT 101, Chicago, IL 60654
Off Market
Zillow last checked:
Listing updated:
Chester Jakala 312-730-4392,
Telequest Corp.,
Joshua Novy,
Telequest Corp.
Not available
Estimated sales range
Not available
Not available
| Date | Event | Price |
|---|---|---|
| 4/14/2026 | Listed for sale | $579,000+17.9%$399/sqft |
Source: | ||
| 2/8/2022 | Listing removed | -- |
Source: Zillow Rental Manager Report a problem | ||
| 1/25/2022 | Listed for rent | $2,950$2/sqft |
Source: Zillow Rental Manager Report a problem | ||
| 9/13/2019 | Sold | $491,000-1.6%$339/sqft |
Source: | ||
| 7/31/2019 | Pending sale | $499,000$344/sqft |
Source: Baird & Warner #10460909 Report a problem | ||
| 7/23/2019 | Listed for sale | $499,000+12.1%$344/sqft |
Source: Baird & Warner #10460909 Report a problem | ||
| 11/1/2013 | Sold | $445,000-5.1%$307/sqft |
Source: | ||
| 8/15/2013 | Pending sale | $469,000$323/sqft |
Source: Baird & Warner Real Estate #08400419 Report a problem | ||
| 7/23/2013 | Listed for sale | $469,000+14.4%$323/sqft |
Source: Baird & Warner #08400419 Report a problem | ||
| 8/24/2007 | Sold | $410,000+26.2%$283/sqft |
Source: Public Record Report a problem | ||
| 2/28/2001 | Sold | $325,000+79.6%$224/sqft |
Source: Public Record Report a problem | ||
| 3/17/1995 | Sold | $181,000$125/sqft |
Source: Public Record Report a problem | ||
| Year | Property taxes | Tax assessment |
|---|---|---|
| 2023 | $9,494 +2.6% | $44,999 |
| 2022 | $9,256 +2.3% | $44,999 |
| 2021 | $9,049 +2.9% | $44,999 +14% |
| 2020 | $8,790 +11% | $39,457 -7.9% |
| 2019 | $7,918 +1.7% | $42,838 |
| 2018 | $7,783 +8.3% | $42,838 +16.6% |
| 2017 | $7,185 +4.7% | $36,752 |
| 2016 | $6,861 +9.7% | $36,752 |
| 2015 | $6,254 +15.5% | $36,752 +15.8% |
| 2014 | $5,414 -6.2% | $31,747 |
| 2013 | $5,774 +1.4% | $31,747 |
| 2012 | $5,697 +9.4% | $31,747 -1.2% |
| 2011 | $5,207 -4.9% | $32,134 -4.5% |
| 2010 | $5,477 +4.4% | $33,659 |
| 2009 | $5,249 +7.7% | $33,659 -0.9% |
| 2008 | $4,874 +1% | $33,976 |
| 2007 | $4,825 +23.6% | $33,976 |
| 2006 | $3,904 -5.1% | $33,976 +4.8% |
| 2005 | $4,116 +1.9% | $32,423 |
| 2004 | $4,039 -21.3% | $32,423 |
| 2003 | $5,131 +16.2% | $32,423 +31.9% |
| 2002 | $4,415 +3.8% | $24,574 |
| 2001 | $4,255 +29.7% | $24,574 |
| 2000 | $3,281 -0.7% | $24,574 +43.9% |
| 1999 | $3,303 | $17,077 |
Source: MRED as distributed by MLS GRID. This data may not be complete. We recommend contacting the local school district to confirm school assignments for this home.
A local agent can set up tours, give advice and negotiate with sellers.
A local lender can help you make sure your offer is ready when you are.