$223,200
-- bd|1 ba|500 sqft
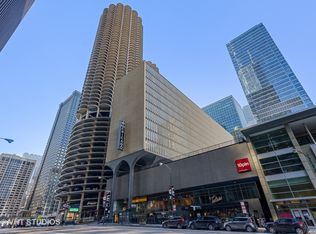
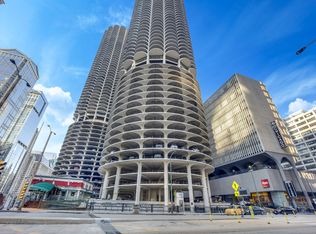
300 N State St APT 2101, Chicago, IL 60654
Off Market
Zillow last checked: 7 hours ago
Listing updated: February 28, 2026 at 01:40pm
Chris Buckely 201-733-2933,
CBy3D, Inc
$291,600
$277,000 - $306,000
$2,415/mo
| Date | Event | Price |
|---|---|---|
| 2/11/2026 | Listed for sale | $298,000+3.5%$411/sqft |
Source: | ||
| 10/3/2022 | Listing removed | -- |
Source: | ||
| 9/6/2022 | Price change | $288,000-3.4%$397/sqft |
Source: | ||
| 8/27/2022 | Price change | $298,000-0.7%$411/sqft |
Source: | ||
| 7/23/2022 | Listed for sale | $300,000+27.1%$414/sqft |
Source: | ||
| 6/28/2016 | Sold | $236,000-0.8%$326/sqft |
Source: | ||
| 4/15/2016 | Pending sale | $238,000$328/sqft |
Source: Alto Realty #09186601 Report a problem | ||
| 4/7/2016 | Listed for sale | $238,000-0.8%$328/sqft |
Source: Alto Realty #09186601 Report a problem | ||
| 11/23/2015 | Listing removed | $240,000$331/sqft |
Source: Alto Realty #09053047 Report a problem | ||
| 11/17/2015 | Price change | $240,000-0.8%$331/sqft |
Source: Alto Realty #09053047 Report a problem | ||
| 10/1/2015 | Listed for sale | $242,000+33.7%$334/sqft |
Source: Alto Realty #09053047 Report a problem | ||
| 7/26/2004 | Sold | $181,000$250/sqft |
Source: Public Record Report a problem | ||
| Year | Property taxes | Tax assessment |
|---|---|---|
| 2023 | $6,330 +2.6% | $29,999 |
| 2022 | $6,170 +2.3% | $29,999 |
| 2021 | $6,033 +13.7% | $29,999 +25.9% |
| 2020 | $5,308 +2.1% | $23,825 -7.9% |
| 2019 | $5,197 +1.7% | $25,866 |
| 2018 | $5,109 -4.3% | $25,866 +4.2% |
| 2017 | $5,341 +7.5% | $24,812 |
| 2016 | $4,970 +9.3% | $24,812 |
| 2015 | $4,547 +11.3% | $24,812 +12.7% |
| 2014 | $4,086 +2% | $22,024 |
| 2013 | $4,006 +0.8% | $22,024 -0.6% |
| 2012 | $3,975 +13.5% | $22,153 +2.5% |
| 2011 | $3,503 -8.4% | $21,617 -8% |
| 2010 | $3,824 -2.1% | $23,497 -6.2% |
| 2009 | $3,906 +24.6% | $25,050 +14.6% |
| 2008 | $3,135 +1% | $21,854 |
| 2007 | $3,104 -1.1% | $21,854 |
| 2006 | $3,137 -1.4% | $21,854 +12.3% |
| 2005 | $3,180 +1% | $19,463 |
| 2004 | $3,148 +2.2% | $19,463 |
| 2003 | $3,080 +34.9% | $19,463 +53.1% |
| 2002 | $2,283 +3.8% | $12,709 |
| 2001 | $2,201 +39.9% | $12,709 |
| 2000 | $1,573 -0.7% | $12,709 +55.3% |
| 1999 | $1,583 | $8,186 |
Source: MRED as distributed by MLS GRID. This data may not be complete. We recommend contacting the local school district to confirm school assignments for this home.