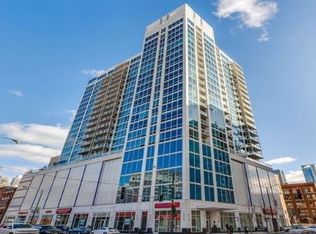
$396,500
2 bd1 ba1.1k sqft
360 W Illinois St APT 226, Chicago, IL 60654
Off Market

Listing description withheld by the listing agent.
Zillow last checked:
Listing updated:
Caroline Serritella 847-220-0219,
@properties Christie's International Real Estate

Not available
Estimated sales range
Not available
Not available
| Date | Event | Price |
|---|---|---|
| 11/10/2026 | Listed for sale | $399,000+10.8%$424/sqft |
Source:  MRED as distributed by MLS GRID #12501673 Report a problem | ||
| 5/27/2021 | Sold | $360,000+9.1%$383/sqft |
Source: MRED as distributed by MLS GRID #11045031 Report a problem | ||
| 4/9/2021 | Pending sale | $330,000$351/sqft |
Source: BHHS Chicago #11045031 Report a problem | ||
| 4/9/2021 | Contingent | $330,000$351/sqft |
Source: MRED as distributed by MLS GRID #11045031 Report a problem | ||
| 4/7/2021 | Listed for sale | $330,000-1.9%$351/sqft |
Source: MRED as distributed by MLS GRID #11045031 Report a problem | ||
| 10/23/2015 | Sold | $336,500+12.5%$358/sqft |
Source: MRED as distributed by MLS GRID #09032711 Report a problem | ||
| 9/14/2015 | Pending sale | $299,000$318/sqft |
Source: Berkshire Hathaway HomeServices KoenigRubloff Realty Group #09032711 Report a problem | ||
| 9/10/2015 | Listed for sale | $299,000+8.7%$318/sqft |
Source: Berkshire Hathaway HomeServices KoenigRubloff Realty Group #09032711 Report a problem | ||
| 10/5/2012 | Sold | $275,000+5.8%$293/sqft |
Source: Public Record Report a problem | ||
| 9/27/2012 | Pending sale | $260,000$277/sqft |
Source: Sergio and Banks Real Estate #08120813 Report a problem | ||
| 7/24/2012 | Listed for sale | $260,000-11.9%$277/sqft |
Source: Sergio and Banks Real Estate #08120813 Report a problem | ||
| 8/4/2009 | Sold | $295,000$314/sqft |
Source: Public Record Report a problem | ||
| Year | Property taxes | Tax assessment |
|---|---|---|
| 2024 | $6,867 -1.8% | $34,182 +3.1% |
| 2023 | $6,994 +2.6% | $33,148 |
| 2022 | $6,818 +13.7% | $33,148 |
| 2021 | $5,996 -1.9% | $33,148 +8.5% |
| 2020 | $6,113 +2.3% | $30,543 -7.9% |
| 2019 | $5,973 +1.7% | $33,160 |
| 2018 | $5,872 +24.1% | $33,160 +30.8% |
| 2017 | $4,731 +3.4% | $25,354 |
| 2016 | $4,578 -1.5% | $25,354 |
| 2015 | $4,646 +5.7% | $25,354 +7% |
| 2014 | $4,397 +2% | $23,696 |
| 2013 | $4,310 +13.3% | $23,696 |
| 2012 | $3,804 +24.8% | $23,696 +13.7% |
| 2011 | $3,049 -20.4% | $20,833 -17.8% |
| 2010 | $3,830 -4.3% | $25,357 -1.2% |
| 2009 | $4,004 +9.5% | $25,676 +0.7% |
| 2008 | $3,656 +1% | $25,487 |
| 2007 | $3,620 -1.1% | $25,487 |
| 2006 | $3,659 -3.2% | $25,487 +10.1% |
| 2005 | $3,781 +1% | $23,141 |
| 2004 | $3,743 +2.2% | $23,141 |
| 2003 | $3,662 +26.3% | $23,141 +43.4% |
| 2002 | $2,899 | $16,137 |
| 2001 | -- | $16,137 |
Source: MRED as distributed by MLS GRID. This data may not be complete. We recommend contacting the local school district to confirm school assignments for this home.

A local agent can set up tours, give advice and negotiate with sellers.
A local lender can help you make sure your offer is ready when you are.