$198,000
-- bd|-- ba|-- sqft
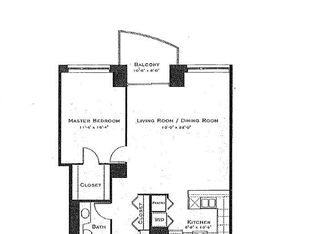
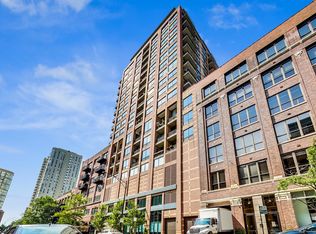
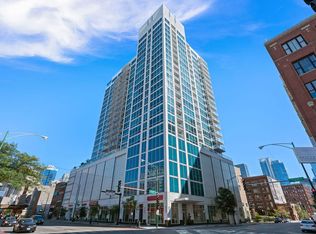
501 N Clinton St APT 420S, Chicago, IL 60654
Off Market
Zillow last checked: 7 hours ago
Listing updated: 18 hours ago
Christie Ascione 773-655-7156,
@properties Christie's International Real Estate,
Lisa Weis 312-953-4153,
@properties Christie's International Real Estate
Not available
Estimated sales range
Not available
Not available
| Date | Event | Price |
|---|---|---|
| 3/11/2026 | Listed for sale | $575,000-4%$372/sqft |
Source: | ||
| 11/13/2024 | Listing removed | $3,950$3/sqft |
Source: MRED as distributed by MLS GRID #12161747 Report a problem | ||
| 11/1/2024 | Listed for rent | $3,950-1.3%$3/sqft |
Source: MRED as distributed by MLS GRID #12161747 Report a problem | ||
| 7/3/2019 | Listing removed | $4,000$3/sqft |
Source: @properties #10415874 Report a problem | ||
| 6/13/2019 | Listed for rent | $4,000$3/sqft |
Source: @properties #10415874 Report a problem | ||
| 6/13/2019 | Listing removed | $599,000$388/sqft |
Source: @properties #10395527 Report a problem | ||
| 6/6/2019 | Price change | $599,000-1%$388/sqft |
Source: @properties #10395527 Report a problem | ||
| 5/29/2019 | Listed for sale | $605,000+11.5%$392/sqft |
Source: @properties #10395527 Report a problem | ||
| 1/30/2015 | Sold | $542,500-3.1%$351/sqft |
Source: | ||
| 11/27/2014 | Pending sale | $560,000$362/sqft |
Source: Berkshire Hathaway HomeServices KoenigRubloff Realty Group #08769731 Report a problem | ||
| 11/7/2014 | Listed for sale | $560,000+72.3%$362/sqft |
Source: Berkshire Hathaway HomeServices KoenigRubloff Realty Group #08769731 Report a problem | ||
| 2/21/2001 | Sold | $325,000$210/sqft |
Source: Public Record Report a problem | ||
| Year | Property taxes | Tax assessment |
|---|---|---|
| 2023 | $10,504 +2.6% | $49,614 |
| 2022 | $10,240 +2.3% | $49,614 |
| 2021 | $10,010 -5.2% | $49,614 +5% |
| 2020 | $10,563 +0.7% | $47,260 -9.2% |
| 2019 | $10,491 +1.7% | $52,045 |
| 2018 | $10,314 +12.3% | $52,045 +22.5% |
| 2017 | $9,180 +7.8% | $42,499 |
| 2016 | $8,512 +9.3% | $42,499 |
| 2015 | $7,788 +27.4% | $42,499 +29% |
| 2014 | $6,113 +2% | $32,947 |
| 2013 | $5,992 +1.4% | $32,947 |
| 2012 | $5,912 -5.1% | $32,947 -14.3% |
| 2011 | $6,227 -0.4% | $38,426 |
| 2010 | $6,253 +4.4% | $38,426 |
| 2009 | $5,992 +17.5% | $38,426 +8.1% |
| 2008 | $5,098 +1% | $35,537 |
| 2007 | $5,047 -1.1% | $35,537 |
| 2006 | $5,102 -12.1% | $35,537 +0% |
| 2005 | $5,807 | $35,536 |
Source: MRED as distributed by MLS GRID. This data may not be complete. We recommend contacting the local school district to confirm school assignments for this home.