$355,700
3 bd|-- ba|990 sqft
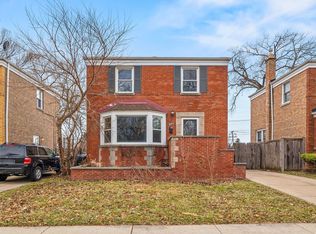
10904 S Drake Ave, Chicago, IL 60655
Off Market
Zillow last checked: 7 hours ago
Listing updated: March 18, 2026 at 08:39am
Jessica Macey (312)282-5652,
Real Broker LLC,
Jorge Delgado 312-208-6290,
Real Broker LLC
Not available
Estimated sales range
Not available
Not available
| Date | Event | Price |
|---|---|---|
| 3/18/2026 | Listed for sale | $369,900-28.2%$154/sqft |
Source: | ||
| 1/24/2025 | Listing removed | $515,000$215/sqft |
Source: | ||
| 12/2/2024 | Listed for sale | $515,000$215/sqft |
Source: | ||
| 8/19/2024 | Listing removed | -- |
Source: Owner Report a problem | ||
| 8/19/2024 | Pending sale | $515,000$215/sqft |
Source: Owner Report a problem | ||
| 8/4/2024 | Listed for sale | $515,000+56.1%$215/sqft |
Source: Owner Report a problem | ||
| 2/5/2021 | Sold | $330,000-2.7%$138/sqft |
Source: Public Record Report a problem | ||
| 11/7/2020 | Pending sale | $339,000$141/sqft |
Source: Owner Report a problem | ||
| 11/5/2020 | Price change | $339,000-2.9%$141/sqft |
Source: Owner Report a problem | ||
| 10/24/2020 | Listed for sale | $349,000+10.8%$145/sqft |
Source: Owner Report a problem | ||
| 8/9/2019 | Sold | $315,000-5.9%$131/sqft |
Source: | ||
| 7/8/2019 | Pending sale | $334,900$140/sqft |
Source: Berkshire Hathaway HomeServices Biros Real Estate #10430660 Report a problem | ||
| 6/26/2019 | Listed for sale | $334,900+92.5%$140/sqft |
Source: Berkshire Hathaway HomeServices Biros Real Estate #10430660 Report a problem | ||
| 8/14/1995 | Sold | $174,000$73/sqft |
Source: Public Record Report a problem | ||
| Year | Property taxes | Tax assessment |
|---|---|---|
| 2023 | $5,420 +2.5% | $25,626 |
| 2022 | $5,287 -6.4% | $25,626 -8.5% |
| 2021 | $5,647 -1.3% | $28,000 +9.3% |
| 2020 | $5,721 +31% | $25,617 -8% |
| 2019 | $4,366 +1.8% | $27,845 |
| 2018 | $4,290 -25.8% | $27,845 +4% |
| 2017 | $5,778 +27.9% | $26,784 |
| 2016 | $4,518 -8.2% | $26,784 |
| 2015 | $4,920 +11.7% | $26,784 +13.1% |
| 2014 | $4,404 +26% | $23,679 |
| 2013 | $3,495 -8.3% | $23,679 |
| 2012 | $3,810 -1.4% | $23,679 -14.9% |
| 2011 | $3,862 +3.1% | $27,823 |
| 2010 | $3,746 +9.5% | $27,823 |
| 2009 | $3,420 +16.6% | $27,823 +2.6% |
| 2008 | $2,932 +14.7% | $27,114 |
| 2007 | $2,556 +10.5% | $27,114 |
| 2006 | $2,312 -5.2% | $27,114 +42.8% |
| 2005 | $2,438 +1.9% | $18,989 |
| 2004 | $2,393 +4.4% | $18,989 |
| 2003 | $2,291 -5.4% | $18,989 +24.3% |
| 2002 | $2,421 -8.7% | $15,278 |
| 2001 | $2,650 +12.4% | $15,278 |
| 2000 | $2,357 -0.1% | $15,278 +7.2% |
| 1999 | $2,361 | $14,252 |
Source: MRED as distributed by MLS GRID. This data may not be complete. We recommend contacting the local school district to confirm school assignments for this home.