$356,100
1 bd|1 ba|-- sqft
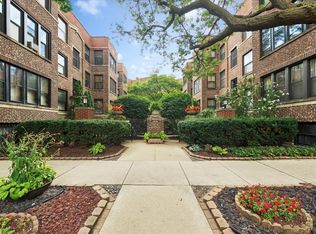
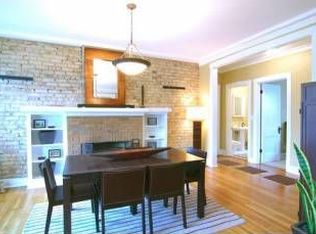
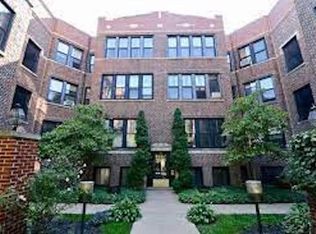
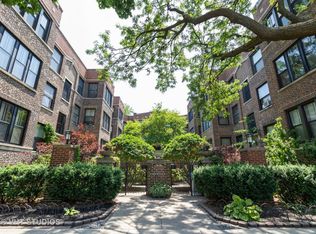
745 W Brompton Ave, Chicago, IL 60657
Off Market
$617,200
$562,000 - $679,000
$3,114/mo
$3,114/mo
Rent Zestimate®
Find your next renter with Zillow Rental Manager. Plus, with online applications, you can quickly screen prospective tenants – for free.
$3,114/mo
Rent Zestimate®
$4,882/mo
Est. payment
Refinancing to a lower rate could help reduce your monthly payments and save thousands over the life of the loan.
$4,882/mo
Est. payment
Work with a Zillow partner agent
Leverage their expertise and Zillow's premium Showcase listings to get your home seen by more buyers.
Get startedList with your own agent
Get your home in front of millions of buyers by listing it on Zillow.
Learn how to do itSell it yourself
Take full control of how buyers see your home on Zillow by listing For Sale by Owner (FSBO).
List your homeZillow last checked:
Listing updated:
David DuFault 312-497-7477,
Chicago Properties Firm
Kelly Smith
Kelly Smith Realty LLC
| Date | Event | Price |
|---|---|---|
| 5/28/2026 | Sold | $615,000+17.1%$424/sqft |
Source: | ||
| 4/28/2026 | Contingent | $525,000$362/sqft |
Source: | ||
| 4/23/2026 | Listed for sale | $525,000+61.5%$362/sqft |
Source: | ||
| 10/19/2022 | Sold | $325,000-6.9%$224/sqft |
Source: | ||
| 10/18/2022 | Pending sale | $349,000$241/sqft |
Source: | ||
| 9/26/2022 | Contingent | $349,000$241/sqft |
Source: | ||
| 9/20/2022 | Listed for sale | $349,000$241/sqft |
Source: | ||
| 9/20/2022 | Listing removed | -- |
Source: | ||
| 9/14/2022 | Contingent | $349,000$241/sqft |
Source: | ||
| 9/12/2022 | Listed for sale | $349,000-2.8%$241/sqft |
Source: | ||
| 9/12/2022 | Listing removed | -- |
Source: | ||
| 8/17/2022 | Listed for sale | $359,000-1.6%$248/sqft |
Source: | ||
| 7/18/2022 | Listing removed | -- |
Source: | ||
| 6/23/2022 | Price change | $365,000-2.7%$252/sqft |
Source: | ||
| 5/10/2022 | Listed for sale | $375,000+15857.4%$259/sqft |
Source: | ||
| 8/1/2019 | Listing removed | $2,400$2/sqft |
Source: EXIT STRATEGY REALTY #10398252 Report a problem | ||
| 5/31/2019 | Listed for rent | $2,400+2.1%$2/sqft |
Source: Exit Strategy Realty #10398252 Report a problem | ||
| 7/3/2015 | Listing removed | $2,350$2/sqft |
Source: Exit Strategy Realty #08946488 Report a problem | ||
| 6/22/2015 | Pending sale | $2,350$2/sqft |
Source: Exit Strategy Realty #08946488 Report a problem | ||
| 6/22/2015 | Listed for sale | $2,350-99.3%$2/sqft |
Source: Exit Strategy Realty #08946488 Report a problem | ||
| 6/22/2015 | Listing removed | $2,350$2/sqft |
Source: Exit Strategy Realty #08946488 Report a problem | ||
| 6/9/2015 | Listed for rent | $2,350+17.5%$2/sqft |
Source: Exit Strategy Realty #08946488 Report a problem | ||
| 2/13/2013 | Listing removed | $2,000$1/sqft |
Source: THE APARTMENT GROUP Report a problem | ||
| 5/22/2012 | Listed for rent | $2,000$1/sqft |
Source: THE APARTMENT GROUP Report a problem | ||
| 3/7/2012 | Listing removed | $2,000$1/sqft |
Source: Century 21 - Affiliated Report a problem | ||
| 11/2/2011 | Listed for rent | $2,000$1/sqft |
Source: THE APARTMENT GROUP Report a problem | ||
| 2/26/2010 | Sold | $314,000+21.2%$217/sqft |
Source: Public Record Report a problem | ||
| 8/14/2000 | Sold | $259,000$179/sqft |
Source: Public Record Report a problem | ||
| Year | Property taxes | Tax assessment |
|---|---|---|
| 2024 | -- | $40,622 +16.9% |
| 2023 | $6,634 +2.9% | $34,756 |
| 2022 | $6,445 +2% | $34,756 |
| 2021 | $6,319 -2.1% | $34,756 +8.3% |
| 2020 | $6,455 +1.5% | $32,080 -8.5% |
| 2019 | $6,358 +1.7% | $35,075 |
| 2018 | $6,250 +31% | $35,075 +37.3% |
| 2017 | $4,771 +3.4% | $25,539 |
| 2016 | $4,615 +9.9% | $25,539 |
| 2015 | $4,199 -18.2% | $25,539 -15.5% |
| 2014 | $5,131 +2.2% | $30,221 |
| 2013 | $5,018 +0.9% | $30,221 |
| 2012 | $4,975 +4.5% | $30,221 -3.8% |
| 2011 | $4,761 +4.5% | $31,403 -4.4% |
| 2010 | $4,556 +2% | $32,849 -5% |
| 2009 | $4,466 +16% | $34,577 +3.2% |
| 2008 | $3,851 +3.2% | $33,516 |
| 2007 | $3,732 +0.8% | $33,516 |
| 2006 | $3,703 -5.1% | $33,516 +20.9% |
| 2005 | $3,904 +1.9% | $27,725 |
| 2004 | $3,831 +4.5% | $27,725 |
| 2003 | $3,668 -5.4% | $27,725 +18.5% |
| 2002 | $3,877 +4.7% | $23,404 |
| 2001 | $3,702 +37.4% | $23,404 |
| 2000 | $2,695 -0.2% | $23,404 +46% |
| 1999 | $2,701 | $16,030 |
Source: MRED as distributed by MLS GRID. This data may not be complete. We recommend contacting the local school district to confirm school assignments for this home.