$220,000
2 bd|2 ba|1.1k sqft
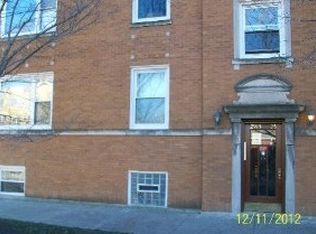
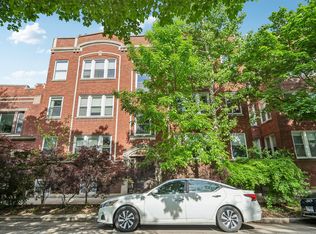
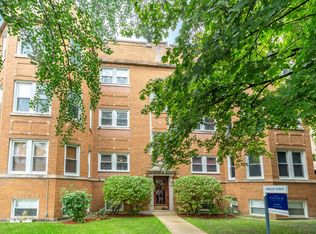
6157 N Richmond St APT 3N, Chicago, IL 60659
Sold
Likely to sell faster than
Zillow last checked:
Listing updated:
Agata Zabludowska, ABR (773)742-5078,
Exit Realty Redefined
$342,500
$325,000 - $360,000
$2,841/mo
| Date | Event | Price |
|---|---|---|
| 4/23/2026 | Listed for sale | $349,000+20.3%$166/sqft |
Source: | ||
| 12/22/2023 | Sold | $290,000$138/sqft |
Source: Public Record Report a problem | ||
| 10/2/2023 | Sold | $290,000-3.3%$138/sqft |
Source: | ||
| 8/26/2023 | Contingent | $299,999$143/sqft |
Source: | ||
| 8/22/2023 | Listed for sale | $299,999-3.2%$143/sqft |
Source: | ||
| 8/22/2023 | Listing removed | -- |
Source: | ||
| 8/17/2023 | Listed for sale | $310,000$148/sqft |
Source: | ||
| 8/17/2023 | Listing removed | -- |
Source: | ||
| 8/8/2023 | Contingent | $310,000$148/sqft |
Source: | ||
| 8/2/2023 | Listed for sale | $310,000-1.6%$148/sqft |
Source: | ||
| 8/2/2023 | Listing removed | -- |
Source: | ||
| 7/25/2023 | Listed for sale | $315,000-3.1%$150/sqft |
Source: | ||
| 7/25/2023 | Listing removed | -- |
Source: | ||
| 7/19/2023 | Listed for sale | $325,000+75.7%$155/sqft |
Source: | ||
| 4/26/2018 | Sold | $185,000-15.5%$88/sqft |
Source: Agent Provided Report a problem | ||
| 7/11/2015 | Listing removed | $219,000$104/sqft |
Source: Coldwell Banker Residential Brokerage - Edgebrook #08914211 Report a problem | ||
| 5/7/2015 | Listed for sale | $219,000+62.4%$104/sqft |
Source: Coldwell Banker Residential Brokerage #08914211 Report a problem | ||
| 4/13/2012 | Sold | $134,830-9.5%$64/sqft |
Source: | ||
| 12/10/2011 | Listed for sale | $149,000-14.4%$71/sqft |
Source: @properties #07957769 Report a problem | ||
| 3/12/2009 | Sold | $174,000-29%$83/sqft |
Source: Public Record Report a problem | ||
| 5/9/2003 | Sold | $245,000$117/sqft |
Source: Public Record Report a problem | ||
| Year | Property taxes | Tax assessment |
|---|---|---|
| 2024 | -- | $32,801 +35.7% |
| 2023 | $4,402 +3.1% | $24,178 |
| 2022 | $4,269 +1.8% | $24,178 |
| 2021 | $4,192 +79.5% | $24,178 +77.9% |
| 2020 | $2,336 -1.7% | $13,589 -11% |
| 2019 | $2,377 +1.8% | $15,260 |
| 2018 | $2,336 +49.6% | $15,260 +43.6% |
| 2017 | $1,561 -4.1% | $10,628 |
| 2016 | $1,628 +11% | $10,628 |
| 2015 | $1,467 -26.6% | $10,628 -20.3% |
| 2014 | $1,997 -17.6% | $13,333 |
| 2013 | $2,425 +1.4% | $13,333 |
| 2012 | $2,393 -2.1% | $13,333 -11.6% |
| 2011 | $2,444 -0.4% | $15,079 |
| 2010 | $2,454 +4.4% | $15,079 |
| 2009 | $2,351 -48.7% | $15,079 -52.9% |
| 2008 | $4,588 +1% | $31,982 |
| 2007 | $4,542 -1.1% | $31,982 |
| 2006 | $4,591 +75.6% | $31,982 +99.8% |
| 2005 | $2,615 +1% | $16,005 |
| 2004 | $2,589 +2.2% | $16,005 |
| 2003 | $2,533 | $16,005 -60.7% |
| 2001 | -- | $40,706 |
Source: MRED as distributed by MLS GRID. This data may not be complete. We recommend contacting the local school district to confirm school assignments for this home.
A local agent can set up tours, give advice and negotiate with sellers.