$378,000
-- bd|-- ba|2.2k sqft
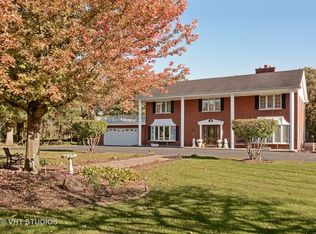
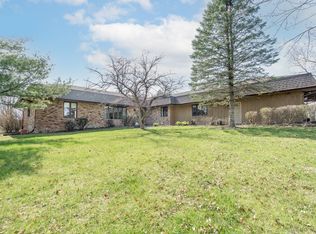
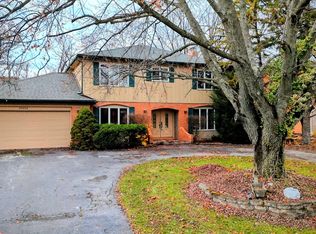
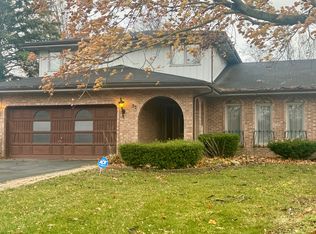
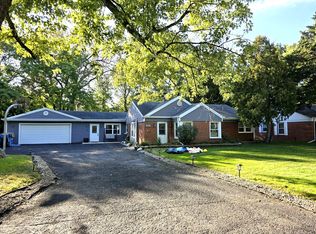
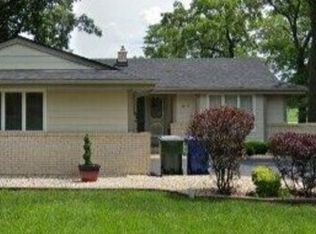
1906 E Marmion Pl, Crete, IL 60417
Off Market
Likely to sell faster than
Zillow last checked: 8 hours ago
Listing updated: February 25, 2026 at 02:19pm
James Mattz 708-798-1111,
Keller Williams Preferred Rlty
Not available
Estimated sales range
Not available
Not available
| Date | Event | Price |
|---|---|---|
| 2/25/2026 | Listed for sale | $260,000-27.8%$84/sqft |
Source: | ||
| 1/16/2026 | Listing removed | $359,900$116/sqft |
Source: | ||
| 12/31/2025 | Listed for sale | $359,900$116/sqft |
Source: | ||
| 12/11/2025 | Listing removed | $359,900$116/sqft |
Source: | ||
| 10/4/2025 | Listed for sale | $359,900$116/sqft |
Source: | ||
| 10/1/2025 | Listing removed | $359,900$116/sqft |
Source: | ||
| 9/23/2025 | Price change | $359,900-2.7%$116/sqft |
Source: | ||
| 9/6/2025 | Price change | $370,000-1.3%$119/sqft |
Source: | ||
| 8/15/2025 | Price change | $375,000-2.6%$121/sqft |
Source: | ||
| 7/27/2025 | Price change | $384,900-3.8%$124/sqft |
Source: | ||
| 7/20/2025 | Listed for sale | $399,900+66.6%$129/sqft |
Source: | ||
| 6/10/2019 | Sold | $240,000-4%$77/sqft |
Source: | ||
| 4/15/2019 | Pending sale | $249,900$81/sqft |
Source: RE/MAX 2000 #10336173 Report a problem | ||
| 4/8/2019 | Listed for sale | $249,900$81/sqft |
Source: RE/MAX 2000 #10336173 Report a problem | ||
| Year | Property taxes | Tax assessment |
|---|---|---|
| 2023 | $9,611 +9% | $98,941 +12.5% |
| 2022 | $8,817 +5.5% | $87,932 +9.2% |
| 2021 | $8,354 +3.4% | $80,509 +6.7% |
| 2020 | $8,078 +3.6% | $75,453 +6.4% |
| 2019 | $7,801 +1.4% | $70,914 +2.2% |
| 2018 | $7,693 +5.8% | $69,388 +8.5% |
| 2017 | $7,273 +0.3% | $63,923 +0.7% |
| 2016 | $7,254 +1.5% | $63,510 +2.8% |
| 2015 | $7,143 | $61,810 -1% |
| 2014 | $7,143 +1.9% | $62,435 -4.6% |
| 2013 | $7,011 +8.2% | $65,425 -8% |
| 2012 | $6,480 0% | $71,114 -9.5% |
| 2011 | $6,480 +0.6% | $78,579 -7.5% |
| 2010 | $6,443 +1.3% | $84,950 -5.9% |
| 2009 | $6,363 +6% | $90,276 |
| 2008 | $6,004 | $90,276 +4.1% |
| 2007 | -- | $86,696 +6.5% |
| 2006 | $5,502 +4.2% | $81,367 +5.3% |
| 2005 | $5,280 +8.6% | $77,271 +8.7% |
| 2004 | $4,864 +1.8% | $71,061 +4% |
| 2003 | $4,776 +0.3% | $68,321 |
| 2002 | $4,763 +2.2% | $68,321 +2.8% |
| 2001 | $4,661 +4.2% | $66,480 +1.7% |
| 2000 | $4,473 | $65,350 |
Source: MRED as distributed by MLS GRID. This data may not be complete. We recommend contacting the local school district to confirm school assignments for this home.