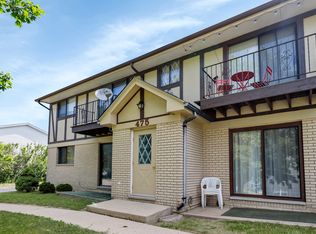
$165,000
2 bd|1 ba|1k sqft
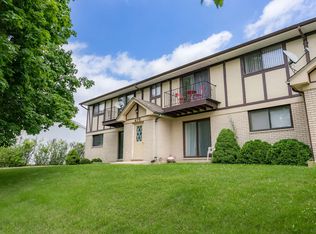
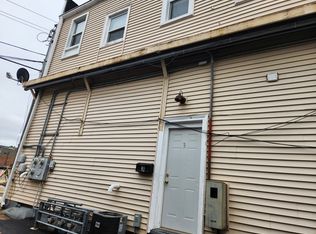
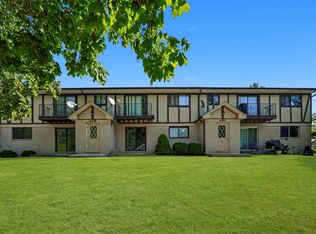
475 S Belmont Ave APT 1, Elgin, IL 60123
Sold
Zillow last checked: 7 hours ago
Listing updated: 22 hours ago
Andrew Namowicz clientcare@starckre.com,
Berkshire Hathaway HomeServices Starck Real Estate
Not available
Estimated sales range
Not available
Not available
| Date | Event | Price |
|---|---|---|
| 4/7/2026 | Listed for sale | $160,000+60%$155/sqft |
Source: | ||
| 3/22/2018 | Sold | $100,000+5.4%$97/sqft |
Source: | ||
| 2/3/2018 | Pending sale | $94,900$92/sqft |
Source: RE/MAX All Pro #09843325 Report a problem | ||
| 1/29/2018 | Listed for sale | $94,900+2.6%$92/sqft |
Source: RE/MAX All Pro #09843325 Report a problem | ||
| 10/25/2017 | Listing removed | $92,500$90/sqft |
Source: St. Charles #09769306 Report a problem | ||
| 10/22/2017 | Price change | $92,500-2.5%$90/sqft |
Source: St. Charles #09769306 Report a problem | ||
| 10/14/2017 | Price change | $94,900-5%$92/sqft |
Source: St. Charles #09769306 Report a problem | ||
| 10/4/2017 | Listed for sale | $99,900+17.5%$97/sqft |
Source: Keller Williams Fox Valley Realty #09769306 Report a problem | ||
| 2/23/2016 | Listing removed | $85,000$83/sqft |
Source: Owner Report a problem | ||
| 2/6/2016 | Listed for sale | $85,000+47.6%$83/sqft |
Source: Owner Report a problem | ||
| 6/8/2011 | Sold | $57,600-39.3%$56/sqft |
Source: | ||
| 9/22/2010 | Listing removed | $94,900$92/sqft |
Source: EXIT REALTY PROFESSIONALS #07629333 Report a problem | ||
| 9/17/2010 | Price change | $94,900-5%$92/sqft |
Source: EXIT REALTY PROFESSIONALS #07629333 Report a problem | ||
| 9/11/2010 | Listed for sale | $99,900+899%$97/sqft |
Source: EXIT REALTY PROFESSIONALS #07629333 Report a problem | ||
| 12/21/2009 | Sold | $10,000-90.6%$10/sqft |
Source: Public Record Report a problem | ||
| 3/20/2009 | Listing removed | $106,900$104/sqft |
Source: foreclosure.com Report a problem | ||
| 3/6/2009 | Price change | $106,900+18.9%$104/sqft |
Source: foreclosure.com Report a problem | ||
| 2/27/2009 | Price change | $89,900-15.9%$87/sqft |
Source: foreclosure.com Report a problem | ||
| 2/25/2009 | Price change | $106,900+18.9%$104/sqft |
Source: foreclosure.com Report a problem | ||
| 2/8/2009 | Price change | $89,900-15.9%$87/sqft |
Source: foreclosure.com Report a problem | ||
| 8/24/2008 | Listed for sale | $106,900-6.2%$104/sqft |
Source: foreclosure.com Report a problem | ||
| 11/23/2005 | Sold | $114,000+11.2%$111/sqft |
Source: Public Record Report a problem | ||
| 1/8/2002 | Sold | $102,500$100/sqft |
Source: Public Record Report a problem | ||
| Year | Property taxes | Tax assessment |
|---|---|---|
| 2024 | $2,570 +6.8% | $40,111 +10.7% |
| 2023 | $2,407 +2.7% | $36,237 +9.7% |
| 2022 | $2,345 +5.6% | $33,042 +7% |
| 2021 | $2,221 +3.7% | $30,892 +4.8% |
| 2020 | $2,142 +3.8% | $29,491 +5% |
| 2019 | $2,063 +2% | $28,092 +6.2% |
| 2018 | $2,023 +3.4% | $26,464 +5.8% |
| 2017 | $1,956 -21% | $25,018 +7.8% |
| 2016 | $2,475 | $23,210 +9.1% |
| 2015 | -- | $21,274 +1.3% |
| 2014 | -- | $21,011 -2.6% |
| 2013 | -- | $21,565 -7.4% |
| 2012 | -- | $23,294 -25.4% |
| 2011 | -- | $31,237 -9.6% |
| 2010 | -- | $34,573 -6.7% |
| 2009 | -- | $37,064 |
| 2008 | -- | $37,064 +3.3% |
| 2007 | -- | $35,873 +4.2% |
| 2006 | -- | $34,430 +6.5% |
| 2005 | -- | $32,331 +6.8% |
| 2004 | -- | $30,284 +7.8% |
| 2003 | -- | $28,095 +18.5% |
| 2002 | -- | $23,708 +7.5% |
| 2001 | -- | $22,064 +5.1% |
| 2000 | -- | $20,997 |
Source: MRED as distributed by MLS GRID. This data may not be complete. We recommend contacting the local school district to confirm school assignments for this home.