$355,700
-- bd|-- ba|875 sqft
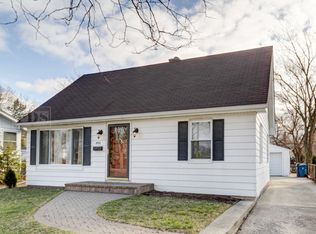
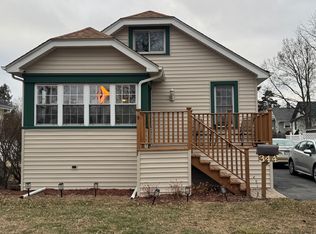
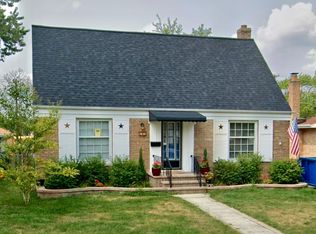
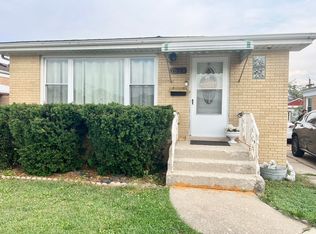
887 S York St, Elmhurst, IL 60126
Off Market
Likely to sell faster than
Zillow last checked: 8 hours ago
Listing updated: February 21, 2026 at 12:07pm
Nader Cheboub (630)518-1987,
Novem Realty, Inc
Not available
Estimated sales range
Not available
Not available
| Date | Event | Price |
|---|---|---|
| 11/27/2025 | Price change | $365,000-2.4%$375/sqft |
Source: | ||
| 7/30/2025 | Price change | $374,000-0.3%$384/sqft |
Source: | ||
| 6/14/2025 | Price change | $375,000-2.6%$385/sqft |
Source: | ||
| 4/29/2025 | Listed for sale | $385,000+80.8%$395/sqft |
Source: | ||
| 10/26/2018 | Listing removed | $1,500$2/sqft |
Source: Long Realty #10090626 Report a problem | ||
| 10/5/2018 | Price change | $1,500-9.1%$2/sqft |
Source: Long Realty #10090626 Report a problem | ||
| 9/22/2018 | Price change | $1,650-5.7%$2/sqft |
Source: Long Realty #10090626 Report a problem | ||
| 8/7/2018 | Price change | $1,750-5.4%$2/sqft |
Source: Long Realty Report a problem | ||
| 6/2/2018 | Listed for rent | $1,850+23.3%$2/sqft |
Source: Zillow Rental Manager Report a problem | ||
| 5/31/2018 | Sold | $213,000-4.4%$219/sqft |
Source: | ||
| 4/24/2018 | Pending sale | $222,900$229/sqft |
Source: @properties #09895180 Report a problem | ||
| 4/9/2018 | Price change | $222,900-7.1%$229/sqft |
Source: @properties #09895180 Report a problem | ||
| 2/23/2018 | Listed for sale | $239,900+33.3%$246/sqft |
Source: @properties #09895180 Report a problem | ||
| 12/13/2016 | Listing removed | $1,500+7.1%$2/sqft |
Source: @properties #09385341 Report a problem | ||
| 1/1/2015 | Listing removed | $1,400$1/sqft |
Source: @properties #08804312 Report a problem | ||
| 12/20/2014 | Listed for rent | $1,400$1/sqft |
Source: @properties #08804312 Report a problem | ||
| 4/29/2003 | Sold | $180,000+52.5%$185/sqft |
Source: Public Record Report a problem | ||
| 10/6/1997 | Sold | $118,000$121/sqft |
Source: Public Record Report a problem | ||
| Year | Property taxes | Tax assessment |
|---|---|---|
| 2024 | $5,930 +7.4% | $98,397 +8.1% |
| 2023 | $5,524 +6.9% | $90,990 +6.8% |
| 2022 | $5,166 +2.4% | $85,200 +2.5% |
| 2021 | $5,043 +3.9% | $83,090 +2.2% |
| 2020 | $4,853 +2% | $81,270 +5.2% |
| 2019 | $4,760 -4% | $77,270 -3.4% |
| 2018 | $4,957 +2% | $80,020 +4.9% |
| 2017 | $4,858 +1.9% | $76,250 +6.2% |
| 2016 | $4,768 +0.7% | $71,830 +7.3% |
| 2015 | $4,736 -24.2% | $66,920 -17.4% |
| 2014 | $6,246 +1.2% | $81,050 -1.4% |
| 2013 | $6,174 +2.8% | $82,190 -6.2% |
| 2012 | $6,008 +5.3% | $87,590 -7.9% |
| 2011 | $5,708 +2.4% | $95,100 -6.8% |
| 2010 | $5,572 +4.3% | $102,040 -6.8% |
| 2009 | $5,342 +6.4% | $109,490 |
| 2008 | $5,020 +5% | $109,490 +8.8% |
| 2007 | $4,781 +19.7% | $100,630 +18.4% |
| 2006 | $3,993 +12.2% | $84,990 +14.6% |
| 2005 | $3,558 +10.7% | $74,180 +6.3% |
| 2004 | $3,215 +2.9% | $69,780 +10.1% |
| 2003 | $3,124 +21.7% | $63,380 +29.2% |
| 2002 | $2,568 +7.4% | $49,050 +8.8% |
| 2001 | $2,391 +3.5% | $45,100 +5.2% |
| 2000 | $2,309 | $42,870 |
Source: MRED as distributed by MLS GRID. This data may not be complete. We recommend contacting the local school district to confirm school assignments for this home.