$641,200
3 bd|3 ba|1.4k sqft
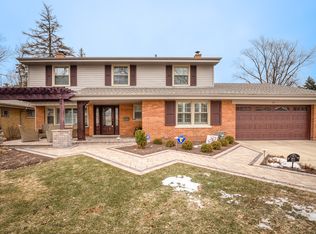
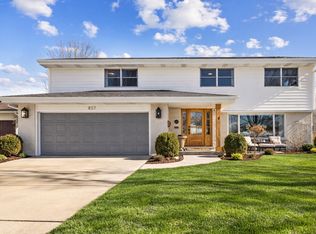
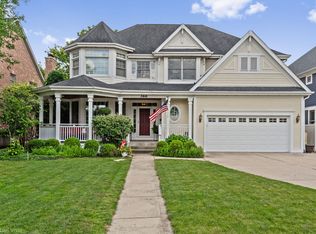
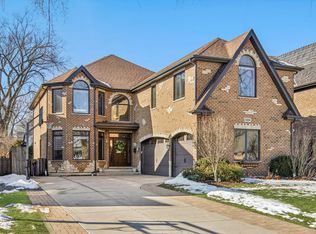
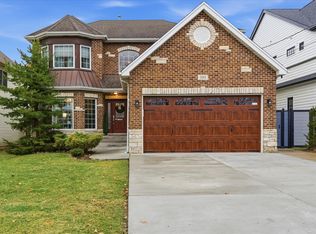
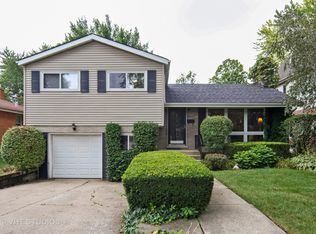
875 S Bryan St, Elmhurst, IL 60126
Off Market
Zillow last checked: 8 hours ago
Listing updated: 10 hours ago
Laura Catrambone-Gerace 708-562-4900,
Coldwell Banker Stratford Place
Not available
Estimated sales range
Not available
Not available
| Date | Event | Price |
|---|---|---|
| 2/22/2026 | Listed for sale | $1,299,000+74.1%$291/sqft |
Source: | ||
| 2/5/2021 | Sold | $746,000-3%$167/sqft |
Source: | ||
| 12/24/2020 | Contingent | $769,000$172/sqft |
Source: | ||
| 12/24/2020 | Pending sale | $769,000$172/sqft |
Source: Metro Realty Inc. #10925806 Report a problem | ||
| 11/21/2020 | Price change | $769,000-1.3%$172/sqft |
Source: Metro Realty Inc. #10925806 Report a problem | ||
| 10/29/2020 | Listed for sale | $779,000+3.9%$174/sqft |
Source: Owner Report a problem | ||
| 11/29/2004 | Sold | $750,000+190.7%$168/sqft |
Source: Public Record Report a problem | ||
| 6/7/2002 | Sold | $258,000+51.8%$58/sqft |
Source: Public Record Report a problem | ||
| 12/7/1998 | Sold | $170,000+7.6%$38/sqft |
Source: Public Record Report a problem | ||
| 10/20/1993 | Sold | $158,000$35/sqft |
Source: Public Record Report a problem | ||
| Year | Property taxes | Tax assessment |
|---|---|---|
| 2024 | $18,865 +7.6% | $321,025 +8.1% |
| 2023 | $17,536 +17.1% | $296,860 +17.4% |
| 2022 | $14,972 +2.5% | $252,900 +2.6% |
| 2021 | $14,605 -19.8% | $246,610 -20.7% |
| 2020 | $18,204 +2.1% | $310,870 +5.2% |
| 2019 | $17,836 +3.7% | $295,560 +4.2% |
| 2018 | $17,207 +2.1% | $283,750 +4.9% |
| 2017 | $16,846 +2% | $270,390 +6.2% |
| 2016 | $16,510 +0.9% | $254,720 +7.3% |
| 2015 | $16,371 +3.6% | $237,300 +12.4% |
| 2014 | $15,802 +1.1% | $211,050 -1.4% |
| 2013 | $15,626 +2.6% | $214,030 -6.2% |
| 2012 | $15,235 +5% | $228,100 -7.9% |
| 2011 | $14,505 +2% | $247,660 -7.1% |
| 2010 | $14,225 +4.1% | $266,520 -6.8% |
| 2009 | $13,659 +6.2% | $285,970 |
| 2008 | $12,860 +5% | $285,970 +8.8% |
| 2007 | $12,251 -1% | $262,840 +4% |
| 2006 | $12,373 +3.9% | $252,840 +6.9% |
| 2005 | $11,907 +307.3% | $236,520 +297.3% |
| 2003 | $2,924 -27.2% | $59,530 -20.4% |
| 2002 | $4,018 +7.1% | $74,770 +8.8% |
| 2001 | $3,750 +3.4% | $68,750 +5.2% |
| 2000 | $3,628 | $65,350 |
Find assessor info on the county website
Source: MRED as distributed by MLS GRID. This data may not be complete. We recommend contacting the local school district to confirm school assignments for this home.