$--
-- bd|-- ba|-- sqft
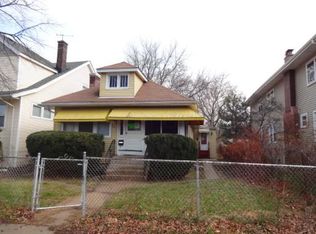
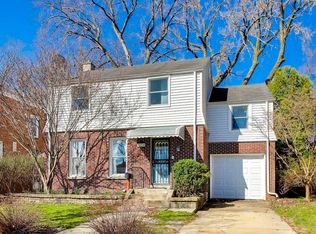
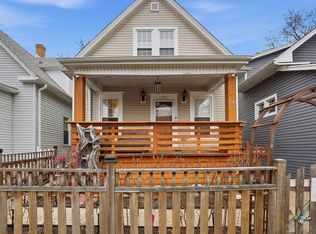
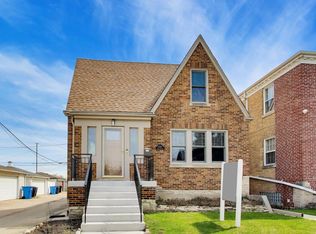
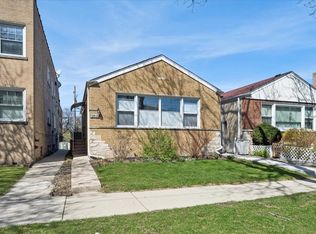
2039 Brown Ave #2, Evanston, IL 60201
Off Market
Zillow last checked: 7 hours ago
Listing updated: March 27, 2026 at 08:04pm
Mary Summerville, SRES 847-507-2644,
Coldwell Banker,
Jason Cox,
Coldwell Banker
Not available
Estimated sales range
Not available
Not available
| Date | Event | Price |
|---|---|---|
| 3/20/2026 | Listed for sale | $550,000 |
Source: | ||
| 3/20/2026 | Listing removed | $550,000 |
Source: | ||
| 3/5/2026 | Listed for sale | $550,000-4.3% |
Source: | ||
| 3/5/2026 | Listing removed | $575,000 |
Source: | ||
| 2/25/2026 | Listed for sale | $575,000+9.5% |
Source: | ||
| 9/12/2025 | Listing removed | $525,000 |
Source: | ||
| 8/5/2025 | Listed for sale | $525,000-8.7% |
Source: | ||
| 8/5/2025 | Listing removed | $575,000 |
Source: | ||
| 8/1/2025 | Listed for sale | $575,000+105.4% |
Source: | ||
| 10/4/2016 | Sold | $280,000-3.1% |
Source: | ||
| 8/24/2016 | Pending sale | $289,000 |
Source: Weichert REALTORS - Lakeshore Partners #09317491 Report a problem | ||
| 8/16/2016 | Listed for sale | $289,000+28.4% |
Source: Weichert REALTORS - Lakeshore Partners #09317491 Report a problem | ||
| 2/8/2013 | Sold | $225,000 |
Source: | ||
| 8/7/2012 | Price change | $225,000-10% |
Source: @properties #08128315 Report a problem | ||
| 3/6/2012 | Listed for sale | $250,000+212.5% |
Source: @properties #08128315 Report a problem | ||
| 9/13/2011 | Sold | $80,000-77.1% |
Source: Public Record Report a problem | ||
| 6/14/2007 | Sold | $350,000+46.4% |
Source: Public Record Report a problem | ||
| 9/30/2005 | Sold | $239,000-14.6% |
Source: Public Record Report a problem | ||
| 4/21/2004 | Sold | $280,000+69.7% |
Source: Public Record Report a problem | ||
| 10/31/2002 | Sold | $165,000 |
Source: Public Record Report a problem | ||
| Year | Property taxes | Tax assessment |
|---|---|---|
| 2023 | $7,021 +4.2% | $29,000 |
| 2022 | $6,736 +45% | $29,000 +65.7% |
| 2021 | $4,645 +1.4% | $17,504 |
| 2020 | $4,583 -3.3% | $17,504 -13.5% |
| 2019 | $4,741 +0.3% | $20,236 +17.3% |
| 2018 | $4,727 -15% | $17,254 -17.2% |
| 2017 | $5,562 +5.4% | $20,846 |
| 2016 | $5,276 +27.4% | $20,846 +35% |
| 2015 | $4,142 -22.3% | $15,446 -23% |
| 2014 | $5,328 +2.4% | $20,061 |
| 2013 | $5,205 -13.2% | $20,061 -20.9% |
| 2012 | $5,995 -4.3% | $25,370 -8.7% |
| 2011 | $6,266 +0.5% | $27,782 |
| 2010 | $6,235 -31.4% | $27,782 -36.8% |
| 2009 | $9,086 +2.8% | $43,937 -4% |
| 2008 | $8,841 +3.8% | $45,768 |
| 2007 | $8,514 +82.8% | $45,768 +106.2% |
| 2006 | $4,659 +1.7% | $22,201 |
| 2005 | $4,581 +2.6% | $22,201 |
| 2004 | $4,466 -13% | $22,201 -4.7% |
| 2003 | $5,135 +31% | $23,298 +27.4% |
| 2002 | $3,920 +107.2% | $18,291 |
| 2001 | $1,892 +1.5% | $18,291 +85.5% |
| 2000 | $1,863 +3% | $9,859 |
| 1999 | $1,808 | $9,859 |
Source: MRED as distributed by MLS GRID. This data may not be complete. We recommend contacting the local school district to confirm school assignments for this home.