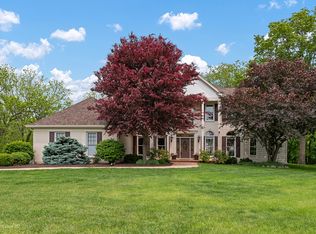
$725,400
-- bd|3 ba|3.9k sqft
18069 W Pond Ridge Cir, Gurnee, IL 60031
Off Market
Likely to sell faster than
Zillow last checked: 8 hours ago
Listing updated: March 06, 2026 at 09:42am
Lisa Kowalenko 847-321-0661,
Keller Williams Thrive
$698,000
$663,000 - $733,000
$3,922/mo
| Date | Event | Price |
|---|---|---|
| 3/6/2026 | Listed for sale | $715,000+12.6%$171/sqft |
Source: | ||
| 3/25/2023 | Listing removed | -- |
Source: | ||
| 3/19/2023 | Price change | $634,900-2.2%$152/sqft |
Source: | ||
| 3/8/2023 | Price change | $649,000-2.4%$155/sqft |
Source: | ||
| 2/26/2023 | Listed for sale | $665,000+9%$159/sqft |
Source: | ||
| 5/18/2022 | Sold | $610,000+3.6%$146/sqft |
Source: | ||
| 3/27/2022 | Contingent | $589,000$141/sqft |
Source: | ||
| 3/23/2022 | Listed for sale | $589,000+57.1%$141/sqft |
Source: | ||
| 4/19/2013 | Sold | $375,000-6.1%$89/sqft |
Source: | ||
| 1/30/2013 | Pending sale | $399,500$95/sqft |
Source: CENTURY 21 Roberts and Andrews #07503466 Report a problem | ||
| 1/24/2013 | Price change | $399,500-6%$95/sqft |
Source: CENTURY 21 Roberts and Andrews #07503466 Report a problem | ||
| 6/7/2012 | Price change | $425,000-5.6%$101/sqft |
Source: CENTURY 21 Roberts and Andrews #07503466 Report a problem | ||
| 3/14/2012 | Price change | $450,000-9.1%$107/sqft |
Source: CENTURY 21 Roberts and Andrews #07503466 Report a problem | ||
| 10/19/2011 | Price change | $495,000-5.7%$118/sqft |
Source: CENTURY 21 Roberts and Andrews #07503466 Report a problem | ||
| 8/6/2011 | Price change | $525,000-4.5%$125/sqft |
Source: Roberts and Andrews #07503466 Report a problem | ||
| 6/14/2011 | Price change | $550,000-3.3%$131/sqft |
Source: Roberts and Andrews #07503466 Report a problem | ||
| 5/4/2011 | Price change | $569,000-1.9%$136/sqft |
Source: Roberts and Andrews #07503466 Report a problem | ||
| 2/7/2010 | Listed for sale | $580,000$138/sqft |
Source: BIRDVIEW Technologies. Inc. #07503466 Report a problem | ||
| Year | Property taxes | Tax assessment |
|---|---|---|
| 2023 | $16,124 -3.8% | $194,901 +12% |
| 2022 | $16,766 +10% | $173,990 +2.5% |
| 2021 | $15,246 +3.8% | $169,774 +6.8% |
| 2020 | $14,689 +1.9% | $158,958 +3% |
| 2019 | $14,421 +0.9% | $154,343 -1.4% |
| 2018 | $14,294 | $156,565 +2.9% |
| 2017 | $14,294 +3.4% | $152,079 +4.7% |
| 2016 | $13,824 +12.7% | $145,308 +5.4% |
| 2015 | $12,268 -1.9% | $137,811 +11.1% |
| 2014 | $12,510 -6.9% | $124,038 -5.9% |
| 2012 | $13,439 +9.7% | $131,854 -18.5% |
| 2011 | $12,256 -8.1% | $161,831 -11.3% |
| 2010 | $13,333 +0.9% | $182,403 -7% |
| 2009 | $13,217 +2.1% | $196,206 -1.1% |
| 2008 | $12,947 +13.1% | $198,446 +15% |
| 2006 | $11,445 +0.2% | $172,498 |
| 2005 | $11,423 +9% | -- |
| 2004 | $10,482 +107.4% | -- |
| 2003 | $5,054 -47.6% | -- |
| 2002 | $9,639 +108.7% | -- |
| 2001 | $4,618 -48.5% | $128,314 +3.6% |
| 2000 | $8,965 | $123,836 |
Source: MRED as distributed by MLS GRID. This data may not be complete. We recommend contacting the local school district to confirm school assignments for this home.