$439,300
-- bd|2 ba|2.1k sqft
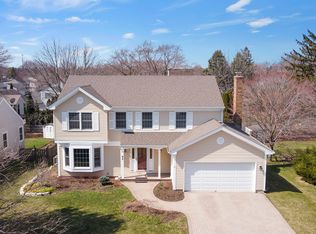
1518 Almaden Ln, Gurnee, IL 60031
Off Market
Likely to sell faster than
Zillow last checked: 7 hours ago
Listing updated: 12 hours ago
Alexander Attiah aattiah@fultongrace.com,
Fulton Grace Realty
Not available
Estimated sales range
Not available
Not available
| Date | Event | Price |
|---|---|---|
| 4/3/2026 | Listed for sale | $489,900+3.1%$229/sqft |
Source: | ||
| 12/2/2024 | Listing removed | -- |
Source: Owner Report a problem | ||
| 11/17/2024 | Listed for sale | $475,000+53.3%$222/sqft |
Source: Owner Report a problem | ||
| 2/24/2021 | Listing removed | -- |
Source: Owner Report a problem | ||
| 9/18/2020 | Listing removed | $2,500$1/sqft |
Source: Owner Report a problem | ||
| 8/29/2020 | Listed for rent | $2,500+13.6%$1/sqft |
Source: Owner Report a problem | ||
| 7/6/2018 | Listing removed | $2,200$1/sqft |
Source: CENTURY 21 Affiliated #09942735 Report a problem | ||
| 5/9/2018 | Listed for rent | $2,200$1/sqft |
Source: CENTURY 21 Affiliated #09942735 Report a problem | ||
| 5/7/2018 | Listing removed | $309,900$145/sqft |
Source: CENTURY 21 Affiliated #09890088 Report a problem | ||
| 4/30/2018 | Listed for sale | $309,900$145/sqft |
Source: CENTURY 21 Affiliated #09890088 Report a problem | ||
| 4/2/2018 | Pending sale | $309,900$145/sqft |
Source: CENTURY 21 Affiliated #09890088 Report a problem | ||
| 3/21/2018 | Listed for sale | $309,900+7.2%$145/sqft |
Source: CENTURY 21 Affiliated #09890088 Report a problem | ||
| 5/15/2017 | Sold | $289,000-3.6%$135/sqft |
Source: | ||
| 3/30/2017 | Pending sale | $299,900$140/sqft |
Source: RE/MAX Top Performers #09577988 Report a problem | ||
| 3/28/2017 | Listed for sale | $299,900-5.1%$140/sqft |
Source: RE/MAX Top Performers #09577988 Report a problem | ||
| 1/29/2004 | Sold | $316,000+60%$148/sqft |
Source: Public Record Report a problem | ||
| 3/28/1996 | Sold | $197,500$93/sqft |
Source: Public Record Report a problem | ||
| Year | Property taxes | Tax assessment |
|---|---|---|
| 2023 | $11,099 +16% | $121,648 +7.7% |
| 2022 | $9,570 +10.7% | $112,940 +8.4% |
| 2021 | $8,648 +3.4% | $104,181 +6.8% |
| 2020 | $8,367 +2.9% | $97,543 +3% |
| 2019 | $8,128 -4.2% | $94,711 -6% |
| 2018 | $8,481 | $100,762 +2.9% |
| 2017 | $8,481 +3.5% | $97,875 +4.7% |
| 2016 | $8,192 +15.6% | $93,517 +5.4% |
| 2015 | $7,087 +3% | $88,692 +16.8% |
| 2014 | $6,881 +5.5% | $75,948 -0.8% |
| 2012 | $6,525 -3.4% | $76,530 -14.3% |
| 2011 | $6,756 +7% | $89,272 -5.6% |
| 2010 | $6,313 +1.9% | $94,544 -15.5% |
| 2009 | $6,198 -12.7% | $111,834 -1.2% |
| 2008 | $7,102 +3.1% | $113,192 +5.4% |
| 2006 | $6,886 +12% | $107,426 |
| 2005 | $6,148 +11.3% | -- |
| 2004 | $5,525 +3.3% | -- |
| 2003 | $5,348 +4.4% | -- |
| 2002 | $5,124 +3.1% | -- |
| 2001 | $4,972 +3.3% | $70,558 +3.5% |
| 2000 | $4,812 | $68,174 |
Find assessor info on the county website
Source: MRED as distributed by MLS GRID. This data may not be complete. We recommend contacting the local school district to confirm school assignments for this home.