$153,900
3 bd|1 ba|1.1k sqft
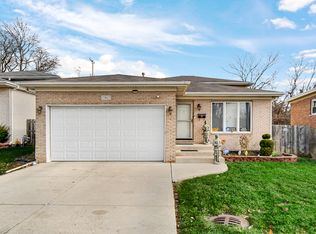
2802 Lexington Dr, Hazel Crest, IL 60429
Off Market
Zillow last checked: 7 hours ago
Listing updated: April 04, 2026 at 05:55pm
Maria Almaraz 708-834-3014,
Midwest SignatureProperties Co,
Alejandrina Almaraz Reveles 773-987-1235,
Midwest SignatureProperties Co
Not available
Estimated sales range
Not available
Not available
| Date | Event | Price |
|---|---|---|
| 4/5/2026 | Price change | $209,000-9.1%$195/sqft |
Source: | ||
| 2/20/2026 | Listed for sale | $229,900+15%$214/sqft |
Source: | ||
| 4/3/2025 | Listing removed | $199,900$186/sqft |
Source: | ||
| 11/8/2024 | Price change | $199,900-11.2%$186/sqft |
Source: | ||
| 7/23/2024 | Listed for sale | $225,000-6.3%$210/sqft |
Source: | ||
| 9/9/2023 | Listing removed | -- |
Source: | ||
| 6/28/2023 | Price change | $240,000-10.8%$224/sqft |
Source: | ||
| 5/6/2023 | Listed for sale | $269,000+12.6%$251/sqft |
Source: | ||
| 9/17/2022 | Listing removed | -- |
Source: | ||
| 6/22/2022 | Price change | $239,000-7.7%$223/sqft |
Source: | ||
| 6/4/2022 | Listed for sale | $259,000+227.8%$241/sqft |
Source: | ||
| 2/19/2021 | Sold | $79,000$74/sqft |
Source: | ||
| 1/26/2021 | Pending sale | $79,000$74/sqft |
Source: | ||
| 1/24/2021 | Price change | $79,000-4.8%$74/sqft |
Source: | ||
| 12/14/2020 | Pending sale | $83,000$77/sqft |
Source: | ||
| 12/13/2020 | Price change | $83,000-5.7%$77/sqft |
Source: RE/MAX Synergy #10949728 Report a problem | ||
| 12/8/2020 | Listed for sale | $88,000+1.1%$82/sqft |
Source: RE/MAX Synergy #10949728 Report a problem | ||
| 1/30/1995 | Sold | $87,000$81/sqft |
Source: Public Record Report a problem | ||
| Year | Property taxes | Tax assessment |
|---|---|---|
| 2023 | $7,171 +1.5% | $13,999 +45.5% |
| 2022 | $7,062 +3.8% | $9,620 |
| 2021 | $6,807 +5.3% | $9,620 |
| 2020 | $6,462 +25.7% | $9,620 +25.2% |
| 2019 | $5,143 -14.1% | $7,681 -16.8% |
| 2018 | $5,990 +7% | $9,232 |
| 2017 | $5,596 +78.4% | $9,232 +17.4% |
| 2016 | $3,137 +6.9% | $7,863 |
| 2015 | $2,935 +1.5% | $7,863 |
| 2014 | $2,892 +26.2% | $7,863 +6% |
| 2013 | $2,292 +1.2% | $7,416 |
| 2012 | $2,266 -27.8% | $7,416 -21.1% |
| 2011 | $3,139 -10.5% | $9,403 -36.4% |
| 2010 | $3,506 +13.5% | $14,782 |
| 2009 | $3,089 +7.8% | $14,782 -5% |
| 2008 | $2,866 +3.6% | $15,561 +24.2% |
| 2007 | $2,767 +4.7% | $12,526 |
| 2006 | $2,643 -26.7% | $12,526 |
| 2005 | $3,607 +18.3% | $12,526 +26.4% |
| 2004 | $3,050 +1.7% | $9,906 |
| 2003 | $2,999 +3.3% | $9,906 |
| 2002 | $2,903 +33.6% | $9,906 +13.7% |
| 2001 | $2,174 -18.9% | $8,711 |
| 2000 | $2,680 +43.5% | $8,711 |
| 1999 | $1,868 | $8,711 |
Source: MRED as distributed by MLS GRID. This data may not be complete. We recommend contacting the local school district to confirm school assignments for this home.