$788,600
-- bd|1 ba|2k sqft
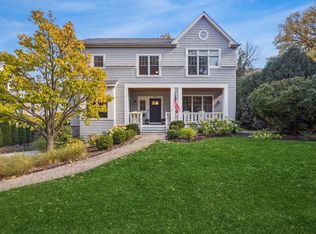
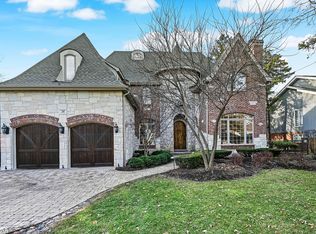
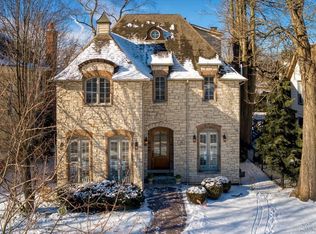
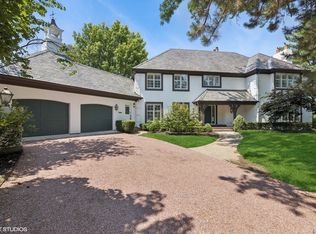
5567 S Oak St, Hinsdale, IL 60521
Off Market
Zillow last checked: 8 hours ago
Listing updated: 18 hours ago
Jurgita Gurevicius 630-546-7555,
Goral Real Estate Inc.,
Anna Goral,
Goral Real Estate Inc.
Not available
Estimated sales range
Not available
Not available
| Date | Event | Price |
|---|---|---|
| 2/20/2026 | Listed for sale | $1,999,990+70.9%$433/sqft |
Source: | ||
| 5/30/2014 | Sold | $1,170,000-0.8%$254/sqft |
Source: | ||
| 4/23/2014 | Pending sale | $1,180,000$256/sqft |
Source: Coldwell Banker Residential Brokerage - Hinsdale Village #08437551 Report a problem | ||
| 4/23/2014 | Listed for sale | $1,180,000$256/sqft |
Source: Coldwell Banker Residential Brokerage - Hinsdale Village #08437551 Report a problem | ||
| 3/13/2014 | Listing removed | $1,180,000$256/sqft |
Source: Coldwell Banker Residential Brokerage - Hinsdale Village #08437551 Report a problem | ||
| 1/28/2014 | Price change | $1,180,000-6.3%$256/sqft |
Source: Coldwell Banker Residential Brokerage - Hinsdale Village #08437551 Report a problem | ||
| 9/6/2013 | Price change | $1,260,000-8.7%$273/sqft |
Source: Coldwell Banker Residential Brokerage - Hinsdale Village #08437551 Report a problem | ||
| 6/6/2013 | Listed for sale | $1,380,000+30.2%$299/sqft |
Source: Coldwell Banker Residential Brokerage - Hinsdale Village #08437551 Report a problem | ||
| 9/25/1997 | Sold | $1,060,000+336.2%$230/sqft |
Source: Public Record Report a problem | ||
| 7/15/1996 | Sold | $243,000$53/sqft |
Source: Public Record Report a problem | ||
| Year | Property taxes | Tax assessment |
|---|---|---|
| 2024 | $23,900 +5.2% | $469,026 +8.8% |
| 2023 | $22,728 +1% | $431,170 -0.9% |
| 2022 | $22,497 +3.8% | $435,100 +1.2% |
| 2021 | $21,679 +2.3% | $430,150 +2% |
| 2020 | $21,188 -0.1% | $421,630 |
| 2019 | $21,202 -3.1% | -- |
| 2018 | $21,890 +3.7% | $432,530 +3.9% |
| 2017 | $21,100 +1.9% | $416,220 +4.8% |
| 2016 | $20,699 +0.4% | $397,230 +6.3% |
| 2015 | $20,612 -6.2% | $373,720 -2.8% |
| 2014 | $21,980 +2% | $384,340 +0.5% |
| 2013 | $21,551 +0.3% | $382,540 -4.3% |
| 2012 | $21,492 +5% | $399,760 -6.1% |
| 2011 | $20,476 +9.3% | $425,730 -1.2% |
| 2010 | $18,737 +4.6% | $430,970 -5.8% |
| 2009 | $17,914 +3.2% | $457,460 |
| 2008 | $17,361 +3.5% | $457,460 +5.9% |
| 2007 | $16,771 -16.7% | $431,970 -13.3% |
| 2006 | $20,138 +4.5% | $498,390 +7.7% |
| 2005 | $19,266 -2.7% | $462,750 +7% |
| 2004 | $19,799 +10.6% | $432,470 +10% |
| 2003 | $17,909 +7.7% | $393,150 +13.9% |
| 2002 | $16,624 +11.2% | $345,170 +7.1% |
| 2001 | $14,946 +4.8% | $322,210 +7% |
| 2000 | $14,261 | $301,080 |
Source: MRED as distributed by MLS GRID. This data may not be complete. We recommend contacting the local school district to confirm school assignments for this home.