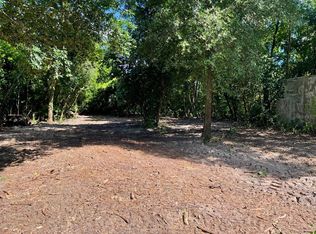
Vacant lot in an established neighborhood. East access to all necessary amenities and US 19.
Pending
$55,000
HUDSON, FL 34669
--beds
0baths
0.61Acres
Unimproved Land
Built in ----
0.61 Acres Lot
$-- Zestimate®
$--/sqft
$-- HOA
What's special
- 16 days
- 67
- 0
Zillow last checked:
Listing updated:
Listed by:
Pamela Zibell PA 727-698-4881,
BLAKE REAL ESTATE INC 727-359-0388
Source: Stellar MLS,MLS#: TB8558097 Originating MLS: Suncoast Tampa
Facts & features
Interior
Bedrooms & bathrooms
- Bathrooms: 0
Property
Lot
- Size: 0.61 Acres
Details
- Parcel number: 162501012.0000.00843.0
- Zoning: R1MH
- Special conditions: Real Estate Owned
Utilities & green energy
- Sewer: None
- Water: None
- Utilities for property: Other
Community & HOA
Community
- Pet fee: $0 monthly
- Subdivision: PARKWOOD ACRES
HOA
- Has HOA: No
Location
- Region: Hudson
Financial & listing details
- Annual tax amount: $2,979
- Date on market: 10/15/2026
- Listing terms: Cash,Conventional
- Ownership: Fee Simple
- Total actual rent: 0
- Road surface type: Asphalt
Foreclosure details
Estimated market value
Not available
Estimated sales range
Not available
Not available
Price history
| Date | Event | Price |
|---|---|---|
| 2/26/2026 | Sold | $100,300-3.1% |
Source: Public Record Report a problem | ||
| 10/9/2008 | Sold | $103,500+283.3% |
Source: Public Record Report a problem | ||
| 1/23/1997 | Sold | $27,000 |
Source: Public Record Report a problem | ||
Public tax history
| Year | Property taxes | Tax assessment |
|---|---|---|
| 2025 | $2,980 +6.1% | $192,619 +3.9% |
| 2024 | $2,809 +16.3% | $185,443 +40.8% |
| 2023 | $2,414 +20% | $131,680 +10% |
| 2022 | $2,013 +6.5% | $119,710 +21% |
| 2021 | $1,891 +15% | $98,940 +10% |
| 2020 | $1,644 +1.8% | $89,949 +6% |
| 2019 | $1,615 | $84,850 -2% |
| 2018 | $1,615 +7.5% | $86,623 +23.5% |
| 2017 | $1,503 +11.2% | $70,126 +29.7% |
| 2016 | $1,353 +122.5% | $54,055 +0.7% |
| 2015 | $608 +6.1% | $53,679 +5% |
| 2014 | $573 | $51,140 -16.6% |
| 2013 | -- | $61,331 -1.1% |
| 2012 | -- | $62,011 -16.1% |
| 2011 | -- | $73,868 -7.1% |
| 2010 | -- | $79,480 -11.6% |
| 2009 | -- | $89,862 -15.8% |
| 2008 | -- | $106,775 -7% |
| 2007 | -- | $114,833 -2% |
| 2006 | -- | $117,178 +12.6% |
| 2005 | -- | $104,078 +9.3% |
| 2004 | -- | $95,193 -2.5% |
| 2003 | -- | $97,677 +15.9% |
| 2002 | -- | $84,295 +17.4% |
| 2000 | -- | $71,819 +6.9% |
| 1999 | -- | $67,168 |
Monthly payment
Climate risks
Neighborhood: 34669


Similar homes
- $55,0000.42 acres12718 LITEWOOD DRIVE LOT 336, HUDSON, FL 34669Lot/Land
 MLS ID #R4912211, Tracy Brainard, RIVER REALTY GROUP. Stellar MLS
- $45,0003,535.39 acres0 Orland St, Spring Hill, FL 34610Lot/Land
 MLS ID #2260988, Victoria Perez, Tropic Shores Realty LLC. HCMLS
- $48,4000.44 acresHICKS ROAD, HUDSON, FL 34667Lot/Land
 MLS ID #TB8500845, Kaye Williams, BLUE SUN REALTY LLC. Stellar MLS
- $69,9000.53 acres15127 BLUEFISH STREET LOT 1, HUDSON, FL 34667Lot/Land
 MLS ID #TB8429179, Dragana Kolundzic Grgic, DALTON WADE INC. Stellar MLS
- $54,8000.48 acres8149 GULF WAY LOT 44, HUDSON, FL 34667Lot/LandMLS ID #W7881977, Hanan Shahin, EXP REALTY LLC. Stellar MLS
- $79,9001.2 acres11470 MAYA COURT LOT 5, NEW PORT RICHEY, FL 34654Lot/LandMLS ID #TB8502396, Kevin McMullen, CHARLES RUTENBERG REALTY INC. Stellar MLS
- $79,0002.41 acres0 SOUTHWOOD COURT LOT E, NEW PORT RICHEY, FL 34654Lot/LandMLS ID #W7883211, Janina Wozniak, FUTURE HOME REALTY. Stellar MLS
- $45,0000.35 acres0 ORLAND STREET LOT 8, NEW PORT RICHEY, FL 34654Lot/LandMLS ID #W7889575, Victoria Perez, TROPIC SHORES REALTY LLC. Stellar MLS
- $42,9000.28 acres8367 LAFITTE DRIVE LOT 2, HUDSON, FL 34667Lot/LandMLS ID #TB8545813, Joneisy Diaz Ramirez, HOME PRIME REALTY LLC. Stellar MLS
- $59,9950.38 acres0 MOON LAKE CIRCLE LOT 33, NEW PORT RICHEY, FL 34654Lot/LandMLS ID #TB8453984, Ashley Gillum Smith, REAVES REAL ESTATE PROFESSIONALS LLC. Stellar MLS
- $39,0000.33 acres7719 NEW YORK AVENUE LOT 6, HUDSON, FL 34667Lot/LandMLS ID #A4694188, Moe Mossa, SAVVY AVENUE, LLC. Stellar MLS
- $74,9000.92 acres18379 THOMAS BOULEVARD, HUDSON, FL 34667Lot/LandMLS ID #TB8528440, Crystal Littlefield, FLORIDIAN SHORES REALTY LLC. Stellar MLS
- $59,0009,000 sqftLot 23 LYLE CIRCLE LOT 23, HUDSON, FL 34667Lot/LandMLS ID #W7845250, Gena Taylor, F I GREY & SON RESIDENTIAL. Stellar MLS
- $48,9003,600 sqft13020 CLERMONT STREET LOT 97, HUDSON, FL 34667Lot/LandMLS ID #TB8540789, Alissa Caputo, FUTURE HOME REALTY INC. Stellar MLS
- $65,0001.57 acres12842 MIDVALE AVENUE LOT 0000, NEW PORT RICHEY, FL 34654Lot/LandMLS ID #TB8347777, Irena Castro, PEOPLE'S CHOICE REALTY SVC LLC. Stellar MLS
- $64,9905,778 sqft0 MCCRAY DRIVE LOT 2, HUDSON, FL 34667Lot/LandMLS ID #TB8552544, D.J. Brooks, OUT FAST REALTY & INVESTMENTS. Stellar MLS
- $59,9000.26 acresLot 143 & 145 INWOOD DRIVE LOT 143, HUDSON, FL 34667Lot/LandMLS ID #W7845266, Gena Taylor, F I GREY & SON RESIDENTIAL. Stellar MLS
- $54,9006,000 sqftlot 12 NOWIKI AVENUE LOT 12, HUDSON, FL 34667Lot/LandMLS ID #W7879570, Dawn Melancon, NEXTHOME CABANAS REALTY. Stellar MLS
