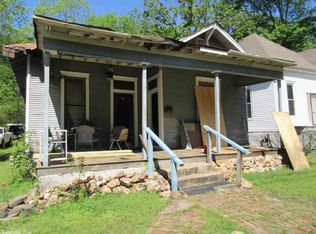
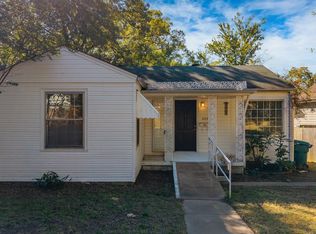
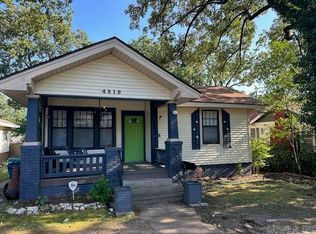
This 3 bedroom, 1 bath, home has made a wonderful rental unit for the current owner. However, this can be your paradise in the city all for yourself! Schedule your personal home tour today!
Active
$225,000
416 S Park St, Little Rock, AR 72205
3beds
1,078sqft
Est.:
Single Family Residence
Built in 1910
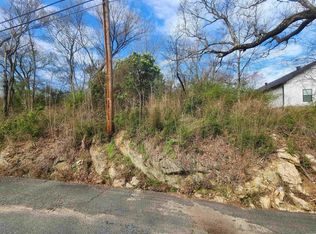
0.71 Acres Lot
$222,100 Zestimate®
$209/sqft
$-- HOA
What's special
- 56 days |
- 166 |
- 4 |
Zillow last checked:
Listing updated:
Listed by:
Jeremy Carter 501-472-3136,
RE/MAX Realty Group 501-205-1094,
Timothy Powell 501-920-4400,
RE/MAX Realty Group
Source: CARMLS,MLS#: 26010591
Tour with a local agent
Facts & features
Interior
Bedrooms & bathrooms
- Bedrooms: 3
- Bathrooms: 1
- Full bathrooms: 1
Rooms
- Room types: None
Dining room
- Features: Eat-in Kitchen
Heating
- Natural Gas
Cooling
- Electric
Appliances
- Included: Free-Standing Range
Features
- Ceiling Fan(s), 3 Bedrooms Same Level
- Flooring: Carpet, Wood, Tile
- Has fireplace: No
- Fireplace features: None
Interior area
- Total structure area: 1,078
- Total interior livable area: 1,078 sqft
Property
Parking
- Total spaces: 2
- Parking features: Parking Pad, Two Car
Features
- Levels: One
- Stories: 1
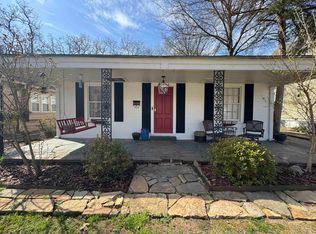
- Patio & porch: Porch
- Waterfront features: Creek
Lot
- Size: 0.71 Acres
- Features: Level, Extra Landscaping, Subdivided
Details
- Parcel number: 34L0420012900
Construction
Type & style
- Home type: SingleFamily
- Architectural style: Traditional
- Property subtype: Single Family Residence
Materials
- Foundation: Crawl Space
- Roof: 3 Tab Shingles
Condition
- New construction: No
- Year built: 1910
Utilities & green energy
- Electric: Elec-Municipal (+Entergy)
- Sewer: Public Sewer
- Water: Public
Community & HOA
Community
- Features: Fitness/Bike Trail
- Subdivision: CAPITOL VIEW
HOA
- Has HOA: No
Location
- Region: Little Rock
Financial & listing details
- Price per square foot: $209/sqft
- Tax assessed value: $101,950
- Annual tax amount: $1,427
- Date on market: 3/19/2026
- Listing terms: VA Loan,FHA,Conventional,Cash
- Road surface type: Paved
Estimated market value
$222,100
$211,000 - $233,000
$1,411/mo
Price history
| Date | Event | Price |
|---|---|---|
| 3/19/2026 | Listed for sale | $225,000+28.6%$209/sqft |
Source: | ||
| 10/5/2024 | Listing removed | $1,200$1/sqft |
Source: Zillow Rentals Report a problem | ||
| 9/16/2024 | Listed for rent | $1,200$1/sqft |
Source: Zillow Rentals Report a problem | ||
| 2/16/2024 | Sold | $175,000-12.5%$162/sqft |
Source: | ||
| 2/15/2024 | Contingent | $199,900$185/sqft |
Source: | ||
| 12/19/2023 | Listed for sale | $199,900+10847.4%$185/sqft |
Source: | ||
| 10/2/2015 | Sold | $1,826-99.3%$2/sqft |
Source: Public Record Report a problem | ||
| 4/3/2015 | Sold | $275,000+7577.3%$255/sqft |
Source: Agent Provided Report a problem | ||
| 4/27/2012 | Sold | $3,582-76.1%$3/sqft |
Source: Public Record Report a problem | ||
| 7/11/2007 | Sold | $15,000+435.9%$14/sqft |
Source: Public Record Report a problem | ||
| 8/9/2004 | Sold | $2,799$3/sqft |
Source: Public Record Report a problem | ||
Public tax history
| Year | Property taxes | Tax assessment |
|---|---|---|
| 2024 | $986 +8.3% | $14,090 +8.3% |
| 2023 | $911 +9.1% | $13,010 +9.1% |
| 2022 | $835 +9.2% | $11,930 +10% |
| 2021 | $765 +7.9% | $10,850 -30.6% |
| 2020 | $709 +7.7% | $15,630 |
| 2019 | $659 +8.3% | $15,630 |
| 2018 | $608 +9% | $15,630 |
| 2017 | $558 | $15,630 +115.6% |
| 2016 | $558 +9.8% | $7,250 |
| 2015 | $508 -28.9% | $7,250 -28.9% |
| 2014 | $714 | $10,190 |
| 2013 | $714 | $10,190 -21.6% |
| 2012 | -- | $12,990 -37.9% |
| 2011 | -- | $20,913 |
| 2010 | -- | $20,913 |
| 2009 | -- | $20,913 -8.8% |
| 2008 | -- | $22,942 |
| 2007 | -- | $22,942 +108.6% |
| 2005 | -- | $11,000 |
| 2004 | -- | $11,000 +97.8% |
| 2003 | -- | $5,562 |
| 2002 | -- | $5,562 |
| 2001 | -- | $5,562 |
Find assessor info on the county website
Monthly payment
Est. payment$--/mo
Payment breakdown
Explore the cost of this home by adjusting the details. Changes won't be saved.
All calculations are estimates and provided by Zillow, Inc. for informational purposes only. Actual amounts may vary.
HOA fees may include property taxes on listings classified as Co-Ops. Contact the listing agent and/or owner for fee details.
Mortgage interest rates are dependent on a number of factors, including credit score, down payment, and repayment length. Interest rate data provided by Zillow Group Marketplace, Inc. as of 1/1/1970 from various mortgage lenders with which we have lead or other similar arrangements; the Estimated Payment is an average of those rates.
See how much you could borrow to make a competitive offer.
Climate risks
Neighborhood: Capitol View-Stifft Station
Nearby schools
GreatSchools rating
- 2/10M.L. King Magnet Elementary SchoolGrades: PK-5Distance: 0.6 mi
- 3/10Dunbar Magnet Middle SchoolGrades: 6-8Distance: 1.2 mi
- 5/10Central High SchoolGrades: 9-12Distance: 0.7 mi
A local agent can set up tours, give advice and negotiate with sellers.
A local lender can help you make sure your offer is ready when you are.

Nearby cities
Nearby neighborhoods
Nearby zip codes
Other Little Rock Topics
