$277,100
-- bd|-- ba|996 sqft
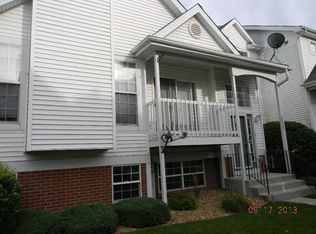
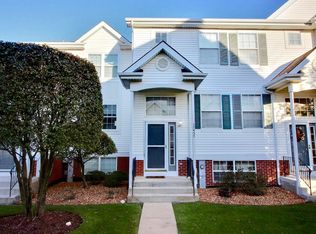
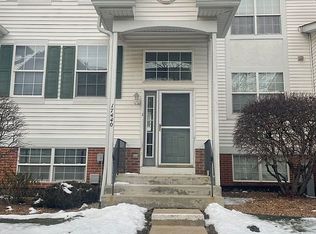
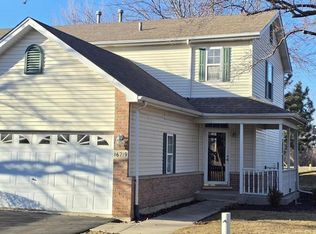
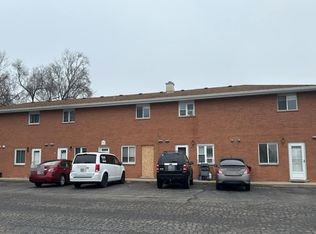
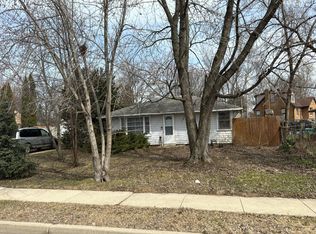
17455 S Teton Cir, Lockport, IL 60441
Off Market
Likely to sell faster than
Zillow last checked: 7 hours ago
Listing updated: 7 hours ago
Christine Eul 708-320-0002,
HomeSmart Realty Group
Not available
Estimated sales range
Not available
Not available
| Date | Event | Price |
|---|---|---|
| 4/2/2026 | Listed for sale | $299,000+49.5%$279/sqft |
Source: | ||
| 8/3/2021 | Sold | $200,000$187/sqft |
Source: Public Record Report a problem | ||
| 6/25/2021 | Pending sale | $200,000$187/sqft |
Source: Owner Report a problem | ||
| 6/4/2021 | Listed for sale | $200,000+11.1%$187/sqft |
Source: Owner Report a problem | ||
| 3/24/2021 | Listing removed | -- |
Source: Owner Report a problem | ||
| 1/31/2020 | Listing removed | $1,550$1/sqft |
Source: Owner Report a problem | ||
| 1/8/2020 | Listed for rent | $1,550+6.9%$1/sqft |
Source: Owner Report a problem | ||
| 1/11/2014 | Listing removed | $1,450$1/sqft |
Source: Zillow Rental Network Report a problem | ||
| 12/3/2013 | Listed for rent | $1,450$1/sqft |
Source: Owner Report a problem | ||
| 10/4/2005 | Sold | $180,000+18.4%$168/sqft |
Source: Public Record Report a problem | ||
| 7/3/2002 | Sold | $152,000+14.7%$142/sqft |
Source: Public Record Report a problem | ||
| 6/16/1997 | Sold | $132,500$124/sqft |
Source: Public Record Report a problem | ||
| Year | Property taxes | Tax assessment |
|---|---|---|
| 2023 | $5,326 +3.4% | $65,074 +7.1% |
| 2022 | $5,152 +5% | $60,760 +5.6% |
| 2021 | $4,905 +0.6% | $57,565 +3.8% |
| 2020 | $4,876 +4.2% | $55,447 +4% |
| 2019 | $4,681 +2.5% | $53,340 +3.7% |
| 2018 | $4,567 +1.8% | $51,450 +2.9% |
| 2017 | $4,487 +2.5% | $50,009 +3.5% |
| 2016 | $4,379 +4.4% | $48,341 +3.9% |
| 2015 | $4,194 | $46,526 +3.9% |
| 2014 | $4,194 +0.6% | $44,798 |
| 2013 | $4,169 +4.1% | $44,798 -2.5% |
| 2012 | $4,003 +0.7% | $45,968 -7.9% |
| 2011 | $3,977 -11.6% | $49,916 -16.4% |
| 2010 | $4,500 +2.4% | $59,675 -2.6% |
| 2009 | $4,393 +0.1% | $61,268 |
| 2008 | $4,389 | $61,268 +4.2% |
| 2007 | -- | $58,815 |
| 2006 | $4,404 +3.3% | $58,815 +7.4% |
| 2005 | $4,263 +3.5% | $54,762 +8.2% |
| 2004 | $4,119 +2.6% | $50,631 +7.9% |
| 2003 | $4,015 +5.4% | $46,915 +3.2% |
| 2002 | $3,811 +5.2% | $45,467 +4.7% |
| 2001 | $3,623 +9.3% | $43,442 +2.8% |
| 2000 | $3,315 | $42,271 |
Source: MRED as distributed by MLS GRID. This data may not be complete. We recommend contacting the local school district to confirm school assignments for this home.