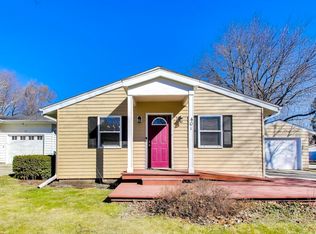
$225,000
2 bd|1 ba|940 sqft
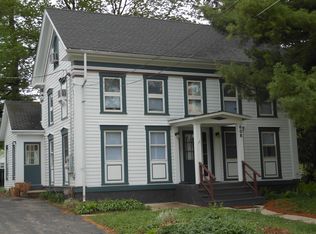
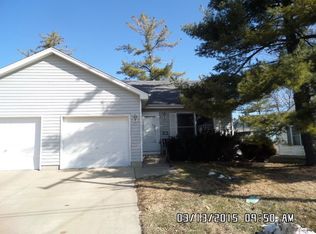
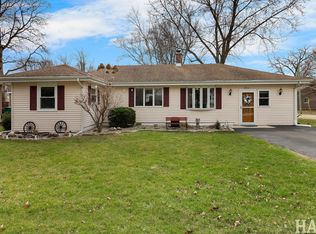
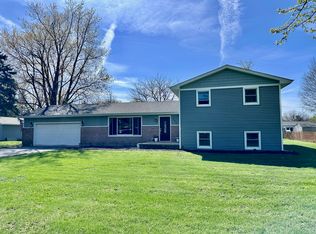
605 Willow St, Maple Park, IL 60151
Sold
Zillow last checked:
Listing updated:
Paul Jaskowiak 630-391-4900,
Prairieland Real Estate Co.
$267,200
$254,000 - $281,000
$2,473/mo
| Date | Event | Price |
|---|---|---|
| 4/22/2026 | Listed for sale | $270,000+94%$144/sqft |
Source: | ||
| 8/21/2023 | Listing removed | -- |
Source: Zillow Rentals Report a problem | ||
| 8/6/2023 | Listed for rent | $1,850$1/sqft |
Source: Zillow Rentals Report a problem | ||
| 3/14/2018 | Sold | $139,143$74/sqft |
Source: | ||
| 2/3/2018 | Pending sale | $139,143$74/sqft |
Source: RE/MAX All Pro #09834064 Report a problem | ||
| 2/1/2018 | Listed for sale | $139,143$74/sqft |
Source: RE/MAX All Pro #09834064 Report a problem | ||
| 1/18/2018 | Pending sale | $139,143$74/sqft |
Source: RE/MAX All Pro #09834064 Report a problem | ||
| 1/16/2018 | Listed for sale | $139,143+16.9%$74/sqft |
Source: RE/MAX All Pro #09834064 Report a problem | ||
| 9/28/2013 | Sold | $119,000-2.4%$63/sqft |
Source: Public Record Report a problem | ||
| 3/2/2013 | Price change | $121,900-9.6%$65/sqft |
Source: RE/MAX Great American North #08335072 Report a problem | ||
| 7/10/2012 | Listed for sale | $134,900-10.1%$72/sqft |
Source: RE/MAX Great American North #08335072 Report a problem | ||
| 3/18/2012 | Listing removed | $150,000$80/sqft |
Source: RE/MAX Great American North #07961057 Report a problem | ||
| 5/5/2011 | Price change | $150,000-5.7%$80/sqft |
Source: Visual Tour #07798196 Report a problem | ||
| 10/30/2010 | Price change | $159,000-1.7%$85/sqft |
Source: Visual Tour #07798196 Report a problem | ||
| 9/24/2010 | Price change | $161,700-0.5%$86/sqft |
Source: Visual Tour #07623779 Report a problem | ||
| 9/11/2010 | Listed for sale | $162,500+3.5%$86/sqft |
Source: Visual Tour #07623779 Report a problem | ||
| 5/27/2005 | Sold | $157,000+50.2%$84/sqft |
Source: Public Record Report a problem | ||
| 9/5/1996 | Sold | $104,500$56/sqft |
Source: Public Record Report a problem | ||
| Year | Property taxes | Tax assessment |
|---|---|---|
| 2024 | $5,665 +2% | $72,707 +7.7% |
| 2023 | $5,555 +33.8% | $67,515 +37% |
| 2022 | $4,153 +4.8% | $49,295 +5.4% |
| 2021 | $3,963 +5% | $46,783 +3.7% |
| 2020 | $3,775 +2.7% | $45,127 +4.2% |
| 2019 | $3,678 +13.1% | $43,312 +14.5% |
| 2018 | $3,251 +5.1% | $37,838 +6.1% |
| 2017 | $3,094 -30.1% | $35,663 -14.8% |
| 2016 | $4,428 | $41,852 +6.3% |
| 2015 | -- | $39,357 +3% |
| 2014 | -- | $38,211 -0.5% |
| 2013 | -- | $38,411 -7.7% |
| 2012 | -- | $41,610 -9.5% |
| 2011 | -- | $45,953 -8.3% |
| 2010 | -- | $50,101 -5.9% |
| 2009 | -- | $53,242 -1.1% |
| 2008 | -- | $53,829 +2.5% |
| 2007 | -- | $52,539 +5.5% |
| 2006 | -- | $49,786 +10.3% |
| 2005 | -- | $45,127 +14.1% |
| 2004 | -- | $39,541 +0.9% |
| 2003 | -- | $39,169 +0.5% |
| 2002 | -- | $38,975 +1.8% |
| 2001 | -- | $38,298 +4.5% |
| 2000 | -- | $36,645 |
Source: MRED as distributed by MLS GRID. This data may not be complete. We recommend contacting the local school district to confirm school assignments for this home.
A local agent can set up tours, give advice and negotiate with sellers.