$221,700
2 bd|1 ba|1k sqft
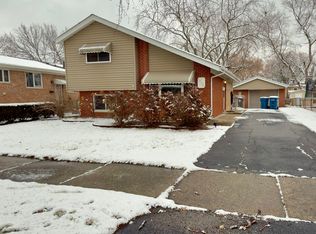
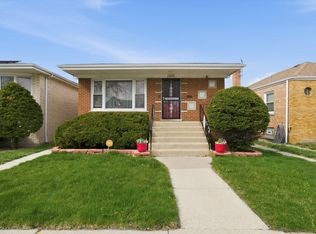
14331 Tripp Ave, Midlothian, IL 60445
Off Market
Zillow last checked:
Listing updated:
Aaron Gaines 708-765-2620,
Keller Williams Preferred Realty
Not available
Estimated sales range
Not available
Not available
| Date | Event | Price |
|---|---|---|
| 4/14/2026 | Listed for sale | $315,000+12.5%$303/sqft |
Source: | ||
| 5/2/2025 | Sold | $280,000+0%$269/sqft |
Source: | ||
| 3/31/2025 | Contingent | $279,900$269/sqft |
Source: | ||
| 3/10/2025 | Price change | $279,900-3.1%$269/sqft |
Source: | ||
| 2/20/2025 | Price change | $289,000-8.3%$278/sqft |
Source: | ||
| 2/8/2025 | Listed for sale | $315,000+125%$303/sqft |
Source: | ||
| 3/23/2016 | Sold | $140,000-6%$135/sqft |
Source: | ||
| 1/13/2016 | Pending sale | $149,000$143/sqft |
Source: RE/MAX "10" CHICAGO #09068890 Report a problem | ||
| 12/10/2015 | Price change | $149,000-6.3%$143/sqft |
Source: RE/MAX "10" CHICAGO #09068890 Report a problem | ||
| 10/22/2015 | Listed for sale | $159,000+103.8%$153/sqft |
Source: RE/MAX "10" CHICAGO #09068890 Report a problem | ||
| 6/26/2015 | Sold | $78,000+4.1%$75/sqft |
Source: Public Record Report a problem | ||
| 5/29/2015 | Pending sale | $74,900$72/sqft |
Source: Crosstown Realtors Inc. #08930889 Report a problem | ||
| 5/22/2015 | Listed for sale | $74,900-58.4%$72/sqft |
Source: Crosstown Realtors Inc. #08930889 Report a problem | ||
| 10/10/2008 | Sold | $180,000+0.1%$173/sqft |
Source: Public Record Report a problem | ||
| 8/10/2008 | Price change | $179,900-2.7%$173/sqft |
Source: RealEstateShows.com #06929672 Report a problem | ||
| 6/17/2008 | Listed for sale | $184,900$178/sqft |
Source: RealEstateShows.com #06929672 Report a problem | ||
| Year | Property taxes | Tax assessment |
|---|---|---|
| 2023 | $5,936 +22.7% | $19,000 +38.5% |
| 2022 | $4,840 +3.1% | $13,721 |
| 2021 | $4,693 +2.8% | $13,721 |
| 2020 | $4,568 -8.5% | $13,721 -8% |
| 2019 | $4,992 +1.7% | $14,922 |
| 2018 | $4,910 -20.1% | $14,922 |
| 2017 | $6,148 +35.6% | $14,922 +14.2% |
| 2016 | $4,533 +3.5% | $13,063 |
| 2015 | $4,379 +2.5% | $13,063 |
| 2014 | $4,272 -0.9% | $13,063 -9.4% |
| 2013 | $4,312 +3.5% | $14,417 |
| 2012 | $4,165 +2.3% | $14,417 |
| 2011 | $4,070 -6.5% | $14,417 -10.4% |
| 2010 | $4,354 -10.6% | $16,086 |
| 2009 | $4,871 +14.3% | $16,086 -10.6% |
| 2008 | $4,260 +41.1% | $18,001 +11.4% |
| 2007 | $3,020 +4% | $16,160 |
| 2006 | $2,903 +15.5% | $16,160 |
| 2005 | $2,513 -4.7% | $16,160 +21.4% |
| 2004 | $2,636 +3.8% | $13,316 |
| 2003 | $2,540 +3.1% | $13,316 |
| 2002 | $2,465 +9.2% | $13,316 +14.6% |
| 2001 | $2,258 +3.8% | $11,615 |
| 2000 | $2,176 | $11,615 |
| 1999 | $2,176 | $11,615 |
Source: MRED as distributed by MLS GRID. This data may not be complete. We recommend contacting the local school district to confirm school assignments for this home.
A local agent can set up tours, give advice and negotiate with sellers.
A local lender can help you make sure your offer is ready when you are.