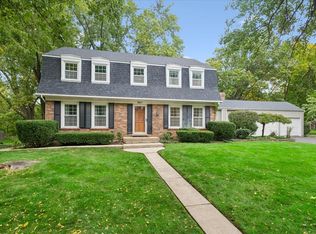
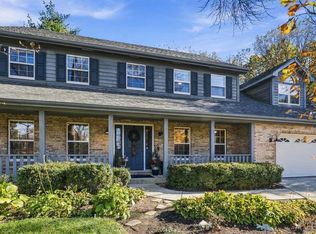
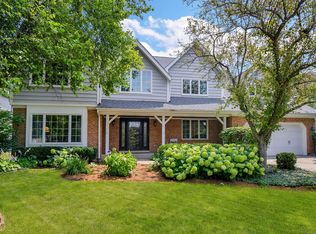
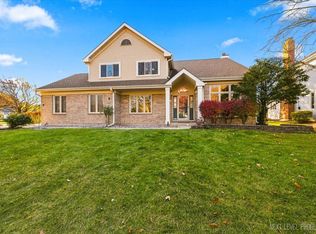
$482,500
-- bd2 ba2k sqft
1121 Hyde Park Ln, Naperville, IL 60565
Off Market
Listing description withheld by the listing agent.
Zillow last checked:
Listing updated:
Kallen O'Shea 630-386-6698,
Baird & Warner,
Will Littaua 630-863-6208,
Baird & Warner

Not available
Estimated sales range
Not available
Not available
| Date | Event | Price |
|---|---|---|
| 11/19/2026 | Listed for sale | $699,900+57.5%$286/sqft |
Source:  MRED as distributed by MLS GRID #12806532 Report a problem | ||
| 5/15/2026 | Sold | $444,500+7.4%$182/sqft |
Source: Public Record Report a problem | ||
| 3/29/2019 | Sold | $414,000-0.2%$169/sqft |
Source: MRED as distributed by MLS GRID #10279145 Report a problem | ||
| 2/25/2019 | Pending sale | $414,900$170/sqft |
Source: Coldwell Banker Residential Brokerage - Naperville #10279145 Report a problem | ||
| 2/22/2019 | Price change | $414,900+0.2%$170/sqft |
Source: Coldwell Banker Residential Brokerage - Naperville #10279145 Report a problem | ||
| 2/10/2019 | Pending sale | $414,000$169/sqft |
Source: Coldwell Banker Residential #10268894 Report a problem | ||
| 2/10/2019 | Listed for sale | $414,000$169/sqft |
Source: Coldwell Banker Residential #10268894 Report a problem | ||
| Year | Property taxes | Tax assessment |
|---|---|---|
| 2025 | $10,072 +3.8% | $180,586 +8.5% |
| 2024 | $9,703 +3.8% | $166,393 +9.6% |
| 2023 | $9,348 +11.2% | $151,860 +11.8% |
| 2022 | $8,406 +3.8% | $135,880 +3.9% |
| 2021 | $8,097 +2.2% | $130,740 +1.8% |
| 2020 | $7,923 +3% | $128,390 +4.5% |
| 2019 | $7,691 0% | $122,840 |
| 2018 | $7,693 +2.1% | $122,840 +3.5% |
| 2017 | $7,536 +2.1% | $118,690 +3.8% |
| 2016 | $7,383 +0.7% | $114,400 +6.2% |
| 2015 | $7,333 +1% | $107,730 +4% |
| 2014 | $7,263 +1.5% | $103,580 -0.2% |
| 2013 | $7,154 +3.2% | $103,830 -3.7% |
| 2012 | $6,932 +1.5% | $107,870 -6% |
| 2011 | $6,830 +3% | $114,700 -3.2% |
| 2010 | $6,630 +1.2% | $118,450 -5% |
| 2009 | $6,553 +2.7% | $124,670 +1.4% |
| 2008 | $6,380 +4.8% | $122,950 +5.9% |
| 2007 | $6,085 +4.8% | $116,100 +7.4% |
| 2006 | $5,804 +3.7% | $108,090 +6.7% |
| 2005 | $5,599 +2.5% | $101,300 +5.9% |
| 2004 | $5,465 +5.5% | $95,660 +8.4% |
| 2003 | $5,179 +3.8% | $88,240 +4.5% |
| 2002 | $4,990 +7.5% | $84,440 +7.5% |
| 2001 | $4,643 +13.7% | $78,540 +5.9% |
| 2000 | $4,085 | $74,160 |
Source: MRED as distributed by MLS GRID. This data may not be complete. We recommend contacting the local school district to confirm school assignments for this home.
A local agent can set up tours, give advice and negotiate with sellers.
A local lender can help you make sure your offer is ready when you are.