$437,600
4 bd|2 ba|1.5k sqft
8352 N Octavia Ave, Niles, IL 60714
Off Market
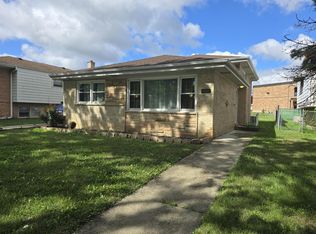
We don't have imagery for this home
Zillow last checked: 7 hours ago
Listing updated: 18 hours ago
Silvia Hernandez 773-775-0600,
RE/MAX City
Not available
Estimated sales range
Not available
Not available
| Date | Event | Price |
|---|---|---|
| 3/24/2026 | Listed for sale | $459,000+61.1%$328/sqft |
Source: | ||
| 9/1/2023 | Listing removed | -- |
Source: MRED as distributed by MLS GRID #11859580 Report a problem | ||
| 8/16/2023 | Listed for rent | $2,700$2/sqft |
Source: MRED as distributed by MLS GRID #11859580 Report a problem | ||
| 8/15/2023 | Listing removed | -- |
Source: Zillow Rentals Report a problem | ||
| 8/9/2023 | Price change | $2,700-8.5%$2/sqft |
Source: Zillow Rentals Report a problem | ||
| 7/27/2023 | Price change | $2,950-4.8%$2/sqft |
Source: Zillow Rentals Report a problem | ||
| 7/11/2023 | Listed for rent | $3,100$2/sqft |
Source: Zillow Rentals Report a problem | ||
| 9/10/2012 | Sold | $285,000-8%$204/sqft |
Source: | ||
| 8/31/2012 | Pending sale | $309,900$221/sqft |
Source: RE/MAX Suburban #08098694 Report a problem | ||
| 6/23/2012 | Listed for sale | $309,900$221/sqft |
Source: RE/MAX Suburban #08098694 Report a problem | ||
| Year | Property taxes | Tax assessment |
|---|---|---|
| 2023 | $7,213 +6.9% | $31,344 |
| 2022 | $6,750 +11.1% | $31,344 +29.1% |
| 2021 | $6,074 +4.6% | $24,285 |
| 2020 | $5,806 +2.4% | $24,285 -10% |
| 2019 | $5,669 -13.8% | $26,984 -4% |
| 2018 | $6,575 +0.7% | $28,119 |
| 2017 | $6,527 +3.5% | $28,119 |
| 2016 | $6,306 +8.4% | $28,119 +29.9% |
| 2015 | $5,816 -7.9% | $21,645 -11.2% |
| 2014 | $6,317 -8.2% | $24,376 -9.9% |
| 2013 | $6,883 +22.4% | $27,046 -2.7% |
| 2012 | $5,625 +2.7% | $27,785 |
| 2011 | $5,474 +16.3% | $27,785 |
| 2010 | $4,708 -5.3% | $27,785 -11.5% |
| 2009 | $4,969 +9.2% | $31,392 -12% |
| 2008 | $4,549 +13.9% | $35,672 |
| 2007 | $3,992 +2.7% | $35,672 +22.7% |
| 2006 | $3,888 +0.4% | $29,073 |
| 2005 | $3,873 +4.9% | $29,073 |
| 2004 | $3,693 +10.6% | $29,073 +41.2% |
| 2003 | $3,340 -0.3% | $20,592 |
| 2002 | $3,349 -0.7% | $20,592 -15% |
| 2001 | $3,374 +1% | $24,218 +20.2% |
| 2000 | $3,342 +1.5% | $20,148 |
| 1999 | $3,291 | $20,148 |
Source: MRED as distributed by MLS GRID. This data may not be complete. We recommend contacting the local school district to confirm school assignments for this home.