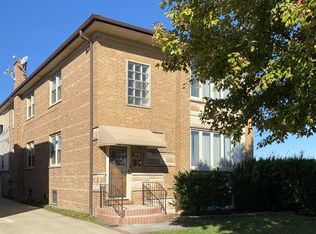
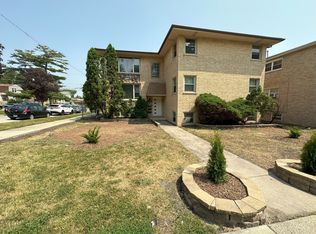
$530,000
3 bd|2 ba|-- sqft
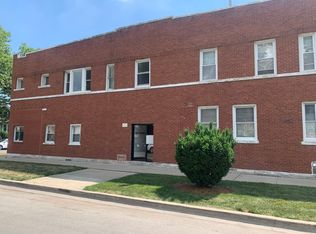
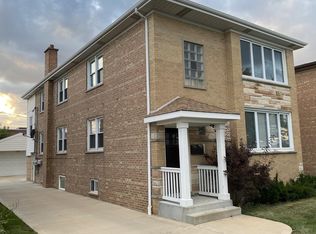
4532 N Nottingham Ave #2, Norridge, IL 60706
Off Market
Zillow last checked: 7 hours ago
Listing updated: 17 hours ago
Tadeusz Dolecki (847)917-7622,
RE/MAX Properties Northwest
Not available
Estimated sales range
Not available
Not available
| Date | Event | Price |
|---|---|---|
| 4/8/2026 | Listed for sale | $799,000 |
Source: | ||
| 2/9/2026 | Contingent | $799,000 |
Source: | ||
| 1/10/2026 | Listed for sale | $799,000+1.3% |
Source: | ||
| 3/22/2024 | Listing removed | -- |
Source: | ||
| 8/26/2023 | Pending sale | $789,000 |
Source: | ||
| 8/22/2023 | Contingent | $789,000 |
Source: | ||
| 8/14/2023 | Listed for sale | $789,000+24.3% |
Source: | ||
| 1/7/2017 | Listing removed | $635,000 |
Source: RE/MAX Properties Northwest #09294798 Report a problem | ||
| 7/23/2016 | Listed for sale | $635,000+62.8% |
Source: RE/MAX Properties Northwest #09294798 Report a problem | ||
| 4/20/2016 | Sold | $390,000 |
Source: Agent Provided Report a problem | ||
| 11/2/2015 | Sold | $390,000-8.2% |
Source: | ||
| 9/24/2015 | Price change | $425,000-3.4% |
Source: Hometown Real Estate #09031474 Report a problem | ||
| 9/6/2015 | Listed for sale | $439,900 |
Source: Hometown Real Estate #09031474 Report a problem | ||
| 6/23/2015 | Listing removed | $439,900 |
Source: Midland Realty Group #08954067 Report a problem | ||
| 6/17/2015 | Listed for sale | $439,900 |
Source: Midland Realty Group #08954067 Report a problem | ||
| Year | Property taxes | Tax assessment |
|---|---|---|
| 2023 | $11,106 +2.7% | $44,000 |
| 2022 | $10,819 +12.9% | $44,000 +26.8% |
| 2021 | $9,583 +3.2% | $34,699 |
| 2020 | $9,289 -3.1% | $34,699 -13.6% |
| 2019 | $9,582 -7.3% | $40,161 +7.2% |
| 2018 | $10,338 +3.1% | $37,455 |
| 2017 | $10,027 +5.8% | $37,455 |
| 2016 | $9,476 +31.9% | $37,455 +45.2% |
| 2015 | $7,183 +1% | $25,803 |
| 2014 | $7,109 +2.3% | $25,803 -14.4% |
| 2013 | $6,948 -6.9% | $30,148 -14.6% |
| 2012 | $7,461 +1.4% | $35,317 |
| 2011 | $7,355 -4.5% | $35,317 -7.3% |
| 2010 | $7,703 +23.8% | $38,091 +17.4% |
| 2009 | $6,220 +10.5% | $32,446 -15% |
| 2008 | $5,628 +7.2% | $38,172 |
| 2007 | $5,248 -6.9% | $38,172 -5.5% |
| 2006 | $5,635 +3.4% | $40,405 |
| 2005 | $5,451 +4.4% | $40,405 |
| 2004 | $5,223 +4% | $40,405 +27.3% |
| 2003 | $5,020 +5.9% | $31,750 |
| 2002 | $4,740 +9.6% | $31,750 |
| 2001 | $4,323 +0% | $31,750 +14.2% |
| 2000 | $4,323 | $27,795 |
| 1999 | $4,323 | $27,795 |
Source: MRED as distributed by MLS GRID. This data may not be complete. We recommend contacting the local school district to confirm school assignments for this home.