$221,500
4 bd|1 ba|850 sqft
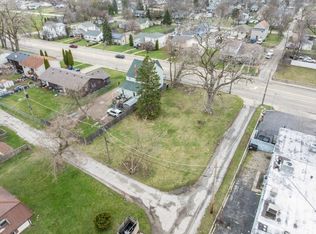
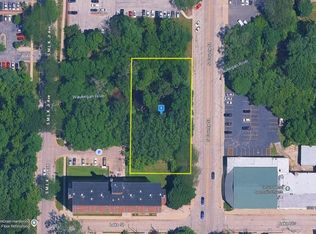
1407 20th St, North chicago, IL 60064
Off Market
Zillow last checked:
Listing updated:
Michael Rychtanek 847-510-5000,
Berkshire Hathaway HomeServices Chicago,
Vaciliki Ress 773-617-7629,
Berkshire Hathaway HomeServices Chicago
Not available
Estimated sales range
Not available
$1,756/mo
| Date | Event | Price |
|---|---|---|
| 4/13/2026 | Listed for sale | $60,000 |
Source: | ||
| 4/13/2026 | Listing removed | $60,000 |
Source: | ||
| 3/24/2026 | Listed for sale | $60,000+1775% |
Source: | ||
| 9/22/2014 | Sold | $3,200-50.8% |
Source: | ||
| 6/23/2014 | Pending sale | $6,500 |
Source: elite Properties Chicago #08576016 Report a problem | ||
| 6/23/2014 | Listed for sale | $6,500 |
Source: elite Properties Chicago #08576016 Report a problem | ||
| 4/22/2014 | Listing removed | $6,500 |
Source: elite Properties Chicago #08576016 Report a problem | ||
| 4/5/2014 | Listed for sale | $6,500-32.6% |
Source: elite Properties Chicago #08576016 Report a problem | ||
| 2/16/2014 | Listing removed | $9,650 |
Source: Hudson & Marshall Report a problem | ||
| 2/4/2014 | Listed for sale | $9,650-89% |
Source: Hudson & Marshall Report a problem | ||
| 2/28/2007 | Sold | $88,000+12.8% |
Source: | ||
| 7/10/2002 | Sold | $78,000+41.8% |
Source: Public Record Report a problem | ||
| 9/30/1994 | Sold | $55,000 |
Source: Public Record Report a problem | ||
| Year | Property taxes | Tax assessment |
|---|---|---|
| 2023 | $774 +26.3% | $6,276 +8.5% |
| 2022 | $613 0% | $5,785 +31.2% |
| 2021 | $613 +4.4% | $4,409 +0.3% |
| 2020 | $588 -0.9% | $4,396 +1.9% |
| 2019 | $593 +7.9% | $4,315 +30.4% |
| 2018 | $549 | $3,309 +1.7% |
| 2017 | $549 +4.8% | $3,254 +5.1% |
| 2016 | $524 -13.5% | $3,097 +6.2% |
| 2015 | $606 -32.5% | $2,916 -22% |
| 2014 | $898 -13.5% | $3,740 -69% |
| 2012 | $1,037 -1.8% | $12,049 -19.2% |
| 2011 | $1,056 -52.9% | $14,918 -47.4% |
| 2010 | $2,244 +1.7% | $28,340 -8.4% |
| 2009 | $2,207 -3.3% | $30,949 -2% |
| 2008 | $2,282 -20.9% | $31,568 +2.8% |
| 2006 | $2,883 +9.7% | $30,720 |
| 2005 | $2,628 +15.5% | -- |
| 2004 | $2,275 +9.3% | -- |
| 2003 | $2,081 -1.9% | -- |
| 2002 | $2,122 +41.8% | -- |
| 2001 | $1,496 -34.4% | $35,161 +5.6% |
| 2000 | $2,280 | $33,297 |
Source: MRED as distributed by MLS GRID. This data may not be complete. We recommend contacting the local school district to confirm school assignments for this home.
A local agent can set up tours, give advice and negotiate with sellers.