$493,700
-- bd|-- ba|-- sqft
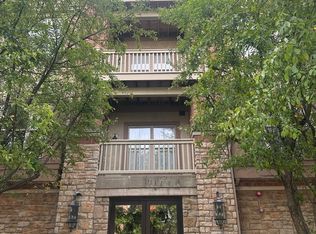
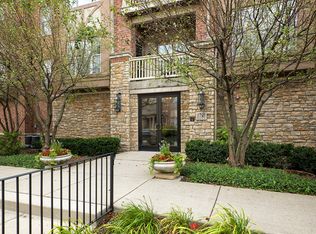
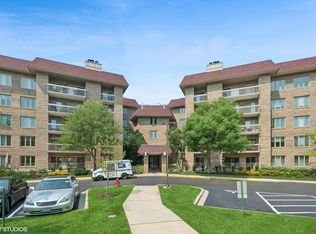
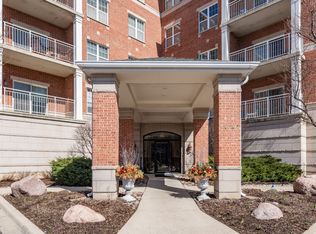
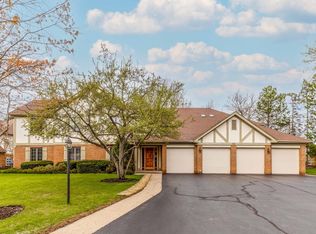
1781 Tudor Ln #P2, Northbrook, IL 60062
Off Market
Likely to sell faster than
Zillow last checked:
Listing updated:
Michelle Ahn 847-616-9910,
Compass
Not available
Estimated sales range
Not available
Not available
| Date | Event | Price |
|---|---|---|
| 4/22/2026 | Contingent | $444,900$287/sqft |
Source: | ||
| 4/16/2026 | Listed for sale | $444,900+48.8%$287/sqft |
Source: | ||
| 9/28/2018 | Listing removed | $299,000$193/sqft |
Source: Baird & Warner #10057918 Report a problem | ||
| 9/28/2018 | Listed for sale | $299,000+7.9%$193/sqft |
Source: Baird & Warner #10057918 Report a problem | ||
| 9/27/2018 | Sold | $277,000-7.4%$179/sqft |
Source: | ||
| 8/28/2018 | Pending sale | $299,000$193/sqft |
Source: Baird & Warner #10057918 Report a problem | ||
| 8/21/2018 | Price change | $299,000-3.2%$193/sqft |
Source: Baird & Warner #10057918 Report a problem | ||
| 8/3/2018 | Price change | $309,000-3.1%$199/sqft |
Source: Baird & Warner #10011156 Report a problem | ||
| 7/9/2018 | Listed for sale | $319,000+59.5%$206/sqft |
Source: Baird & Warner #10011156 Report a problem | ||
| 9/25/2012 | Sold | $200,000+0.1%$129/sqft |
Source: | ||
| 7/11/2012 | Listed for sale | $199,900-4.8%$129/sqft |
Source: foreclosure.com Report a problem | ||
| 2/19/2012 | Listing removed | $210,000$135/sqft |
Source: @properties #07808944 Report a problem | ||
| 11/5/2011 | Price change | $210,000-8.3%$135/sqft |
Source: @properties #07808944 Report a problem | ||
| 8/3/2011 | Price change | $229,000-4.2%$148/sqft |
Source: @properties #07808944 Report a problem | ||
| 5/18/2011 | Listed for sale | $239,000-17.3%$154/sqft |
Source: @properties #07808944 Report a problem | ||
| 3/22/2011 | Listing removed | $288,900$186/sqft |
Source: Coldwell Banker Residential Brokerage - Deerfield #07591715 Report a problem | ||
| 7/29/2010 | Listed for sale | $288,900-19.4%$186/sqft |
Source: NRT Chicago #07591715 Report a problem | ||
| 8/9/2004 | Sold | $358,500$231/sqft |
Source: Public Record Report a problem | ||
| Year | Property taxes | Tax assessment |
|---|---|---|
| 2023 | $6,056 +3.2% | $28,936 |
| 2022 | $5,867 +53.7% | $28,936 +60.5% |
| 2021 | $3,818 -0.5% | $18,031 |
| 2020 | $3,839 +3.9% | $18,031 -9.1% |
| 2019 | $3,693 -21.3% | $19,827 -12.5% |
| 2018 | $4,690 +1.8% | $22,652 |
| 2017 | $4,608 +6.3% | $22,652 |
| 2016 | $4,335 +9% | $22,652 +17.8% |
| 2015 | $3,975 +2.2% | $19,224 |
| 2014 | $3,889 +1.7% | $19,224 |
| 2013 | $3,825 -1.4% | $19,224 -7.1% |
| 2012 | $3,878 +3.5% | $20,699 |
| 2011 | $3,746 +2.6% | $20,699 |
| 2010 | $3,651 -13.8% | $20,699 -19.4% |
| 2009 | $4,238 -8.4% | $25,670 -18.9% |
| 2008 | $4,627 +0.6% | $31,645 |
| 2007 | $4,599 -6.7% | $31,645 +1.2% |
| 2006 | $4,928 +3.6% | $31,277 |
| 2005 | $4,759 | $31,277 |
Source: MRED as distributed by MLS GRID. This data may not be complete. We recommend contacting the local school district to confirm school assignments for this home.
A local agent can set up tours, give advice and negotiate with sellers.
A local lender can help you make sure your offer is ready when you are.