$358,400
4 bd|3 ba|1.4k sqft
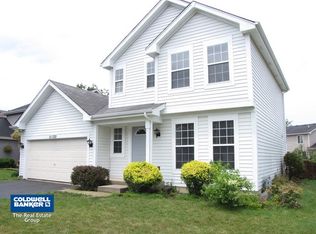
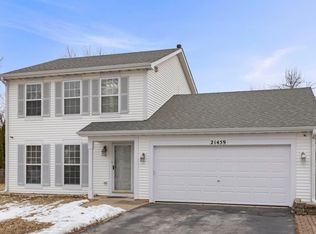
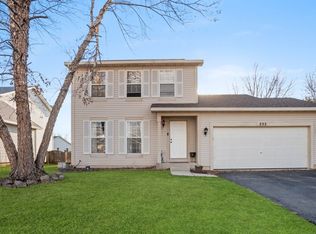
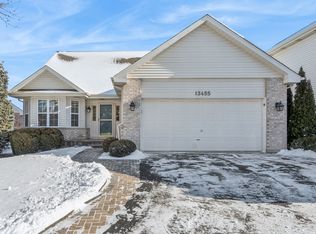
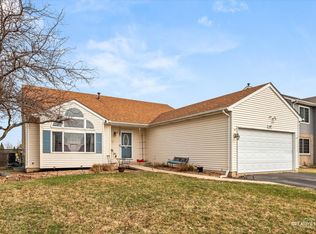
21718 W Jennings Ct, Plainfield, IL 60544
Off Market
Likely to sell faster than
Zillow last checked: 7 hours ago
Listing updated: March 12, 2026 at 04:48pm
Mike Berg 888-276-9959,
Berg Properties
Not available
Estimated sales range
Not available
Not available
| Date | Event | Price |
|---|---|---|
| 3/12/2026 | Listed for sale | $345,000+57.9%$242/sqft |
Source: | ||
| 12/18/2018 | Sold | $218,500$153/sqft |
Source: Public Record Report a problem | ||
| 10/9/2018 | Sold | $218,500-0.6%$153/sqft |
Source: | ||
| 8/21/2018 | Pending sale | $219,900$154/sqft |
Source: john greene Realtor #10053999 Report a problem | ||
| 8/16/2018 | Listed for sale | $219,900$154/sqft |
Source: john greene Realtor #10053999 Report a problem | ||
| 8/4/2018 | Pending sale | $219,900$154/sqft |
Source: john greene Realtor #10034534 Report a problem | ||
| 7/30/2018 | Listed for sale | $219,900$154/sqft |
Source: john greene Realtor #10034534 Report a problem | ||
| 7/18/2018 | Pending sale | $219,900$154/sqft |
Source: john greene Realtor #10034534 Report a problem | ||
| 7/13/2018 | Listed for sale | $219,900+51.7%$154/sqft |
Source: john greene Realtor #10034534 Report a problem | ||
| 7/26/2013 | Sold | $145,000-3.3%$102/sqft |
Source: | ||
| 6/11/2013 | Pending sale | $149,900$105/sqft |
Source: RE/MAX Professionals Select #08253578 Report a problem | ||
| 6/2/2013 | Listed for sale | $149,900+3.5%$105/sqft |
Source: RE/MAX Professionals Select #08253578 Report a problem | ||
| 1/24/2013 | Listing removed | $144,900$102/sqft |
Source: RE/MAX Professionals Select #08253578 Report a problem | ||
| 1/21/2013 | Listed for sale | $144,900-33.2%$102/sqft |
Source: RE/MAX Professionals Select #08253578 Report a problem | ||
| 2/28/2006 | Sold | $217,000+47.6%$152/sqft |
Source: Public Record Report a problem | ||
| 8/21/2000 | Sold | $147,000+9.3%$103/sqft |
Source: Public Record Report a problem | ||
| 2/23/1996 | Sold | $134,500$94/sqft |
Source: Public Record Report a problem | ||
| Year | Property taxes | Tax assessment |
|---|---|---|
| 2023 | $6,058 +6.5% | $87,129 +11.3% |
| 2022 | $5,686 +6% | $78,253 +7% |
| 2021 | $5,362 +1.3% | $73,133 +2.9% |
| 2020 | $5,294 +4.9% | $71,058 +5% |
| 2019 | $5,047 +5% | $67,706 +6.4% |
| 2018 | $4,808 +3.2% | $63,612 +5.2% |
| 2017 | $4,657 +2.4% | $60,451 +4.8% |
| 2016 | $4,545 +5.6% | $57,655 +6.8% |
| 2015 | $4,305 | $54,009 +3.7% |
| 2014 | $4,305 +1.5% | $52,102 |
| 2013 | $4,239 +4.2% | $52,102 -2.2% |
| 2012 | $4,067 -0.6% | $53,301 -9.1% |
| 2011 | $4,092 +0.8% | $58,664 -6.5% |
| 2010 | $4,061 -7.2% | $62,752 -11.6% |
| 2009 | $4,374 +0.8% | $70,961 |
| 2008 | $4,340 | $70,961 +5% |
| 2007 | -- | $67,614 +4.3% |
| 2006 | $4,030 +12.5% | $64,820 +12.4% |
| 2005 | $3,584 +0.1% | $57,663 +5.2% |
| 2004 | $3,580 +10.2% | $54,792 +5% |
| 2003 | $3,249 +6.3% | $52,192 +8.6% |
| 2002 | $3,057 +4.6% | $48,052 +3.7% |
| 2001 | $2,923 +3.5% | $46,342 +1% |
| 2000 | $2,826 | $45,903 |
Source: MRED as distributed by MLS GRID. This data may not be complete. We recommend contacting the local school district to confirm school assignments for this home.