$389,200
3 bd|1 ba|1.3k sqft
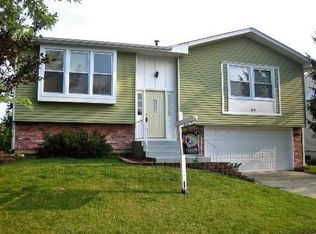
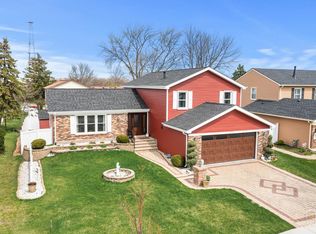
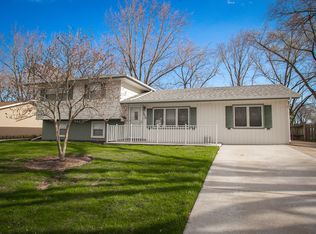
941 Brower Dr, Roselle, IL 60172
Off Market
Likely to sell faster than
Zillow last checked:
Listing updated:
Holly Pfister clientcare@starckre.com,
Berkshire Hathaway HomeServices Starck Real Estate,
Paula Nowicki,
Berkshire Hathaway HomeServices Starck Real Estate
Not available
Estimated sales range
Not available
Not available
| Date | Event | Price |
|---|---|---|
| 4/18/2026 | Listed for sale | $434,900+87.5%$238/sqft |
Source: | ||
| 12/5/2002 | Sold | $232,000$127/sqft |
Source: Public Record Report a problem | ||
| Year | Property taxes | Tax assessment |
|---|---|---|
| 2024 | $8,620 +8% | $122,538 +9.4% |
| 2023 | $7,981 +2.2% | $112,060 +4.2% |
| 2022 | $7,805 +4.6% | $107,580 +5.3% |
| 2021 | $7,460 -0.5% | $102,210 +2.5% |
| 2020 | $7,497 +3.2% | $99,710 +4.1% |
| 2019 | $7,266 -7.1% | $95,820 -4.2% |
| 2018 | $7,819 +4.6% | $100,000 +7.9% |
| 2017 | $7,472 +4% | $92,690 +8.1% |
| 2016 | $7,185 +4.1% | $85,780 +10% |
| 2015 | $6,899 +3.4% | $78,000 +3.9% |
| 2014 | $6,669 +0.9% | $75,070 -3.3% |
| 2013 | $6,610 +3.4% | $77,640 -6.4% |
| 2012 | $6,392 +3.5% | $82,910 -9.4% |
| 2011 | $6,177 +4.2% | $91,540 -4% |
| 2010 | $5,925 +2.6% | $95,390 -6.9% |
| 2009 | $5,776 +1.1% | $102,430 |
| 2008 | $5,712 +4.2% | $102,430 +5.3% |
| 2007 | $5,485 +7.5% | $97,280 +9.6% |
| 2006 | $5,104 +2.5% | $88,770 +6.6% |
| 2005 | $4,979 +5.7% | $83,270 +6.8% |
| 2004 | $4,709 +3.3% | $77,970 +10% |
| 2003 | $4,558 +5% | $70,880 +10.4% |
| 2002 | $4,342 +3.9% | $64,230 +9.1% |
| 2001 | $4,179 +2.5% | $58,890 +4.9% |
| 2000 | $4,077 | $56,140 |
Source: MRED as distributed by MLS GRID. This data may not be complete. We recommend contacting the local school district to confirm school assignments for this home.
A local agent can set up tours, give advice and negotiate with sellers.
A local lender can help you make sure your offer is ready when you are.