$437,300
-- bd|-- ba|-- sqft
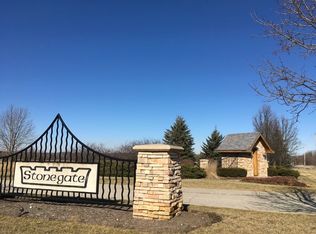
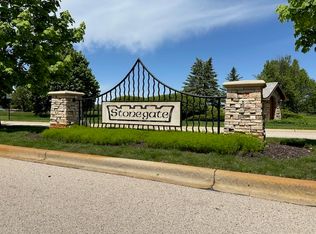
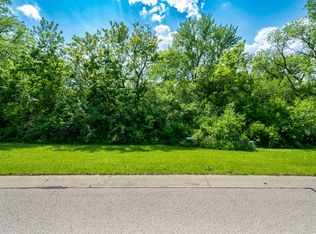
7104 Wildflower Ct, Spring Grove, IL 60081
Off Market
Zillow last checked:
Brittany Countryman 312-420-6363,
Baird & Warner
Not available
Estimated sales range
Not available
Not available
| Date | Event | Price |
|---|---|---|
| 5/21/2025 | Listing removed | -- |
Source: Owner Report a problem | ||
| 2/20/2025 | Listed for sale | $45,000+28.6% |
Source: Owner Report a problem | ||
| 5/21/2023 | Listing removed | -- |
Source: | ||
| 1/17/2023 | Price change | $35,000-12.5% |
Source: | ||
| 10/28/2022 | Price change | $40,000-11.1% |
Source: | ||
| 8/20/2021 | Listed for sale | $45,000+28.6% |
Source: | ||
| 8/16/2021 | Listing removed | -- |
Source: Owner Report a problem | ||
| 7/15/2021 | Price change | $35,000-11.4% |
Source: Owner Report a problem | ||
| 6/15/2021 | Listed for sale | $39,500+107.9% |
Source: Owner Report a problem | ||
| 3/24/2021 | Listing removed | -- |
Source: Owner Report a problem | ||
| 10/6/2020 | Sold | $19,000-24% |
Source: Public Record Report a problem | ||
| 7/30/2020 | Pending sale | $25,000 |
Source: Owner Report a problem | ||
| 7/2/2020 | Listed for sale | $25,000-40.5% |
Source: Owner Report a problem | ||
| 4/20/2019 | Listing removed | $42,000 |
Source: john greene Realtor #10121702 Report a problem | ||
| 10/25/2018 | Price change | $42,000-15.2% |
Source: john greene Realtor #10121702 Report a problem | ||
| 4/26/2018 | Listed for sale | $49,500-45% |
Source: john greene Realtor #10121702 Report a problem | ||
| 6/2/2016 | Listing removed | $90,000 |
Source: Capital Sales LLC #09051074 Report a problem | ||
| 1/19/2016 | Price change | $90,000-84.7% |
Source: Capital Sales LLC #09051074 Report a problem | ||
| 11/28/2015 | Price change | $589,900+555.4% |
Source: Capital Sales LLC #09051074 Report a problem | ||
| 9/29/2015 | Listed for sale | $90,000-10% |
Source: Capital Sales LLC #09051074 Report a problem | ||
| 12/30/2005 | Sold | $100,000 |
Source: Public Record Report a problem | ||
| Year | Property taxes | Tax assessment |
|---|---|---|
| 2024 | $605 +2.3% | $7,910 +9.4% |
| 2023 | $591 +4.9% | $7,231 +11.1% |
| 2022 | $564 +3% | $6,511 +4.2% |
| 2021 | $547 -78.1% | $6,249 -77.5% |
| 2020 | $2,497 | $27,801 +3.3% |
| 2019 | -- | $26,908 +4.3% |
| 2018 | $2,502 -0.3% | $25,796 +5% |
| 2017 | $2,511 +102.2% | $24,565 +6.7% |
| 2016 | $1,242 | $23,031 +5.8% |
| 2013 | $1,242 | $21,776 -22.4% |
| 2011 | -- | $28,079 -6.8% |
| 2010 | -- | $30,131 -8.3% |
| 2009 | -- | $32,862 +2.7% |
| 2008 | -- | $31,986 -5% |
| 2006 | -- | $33,663 +2190% |
| 2005 | $99 | $1,470 |
Source: MRED as distributed by MLS GRID. This data may not be complete. We recommend contacting the local school district to confirm school assignments for this home.
A local agent can set up tours, give advice and negotiate with sellers.