$244,600
3 bd|1 ba|1.3k sqft
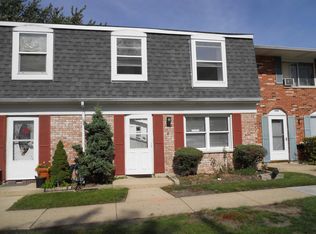
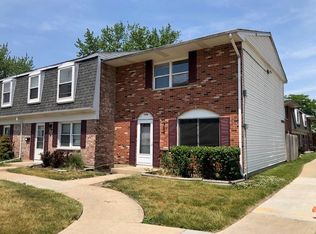
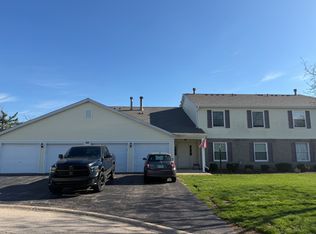
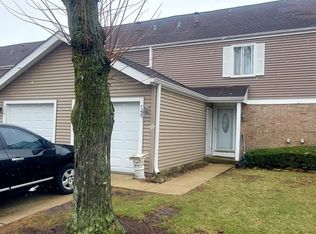
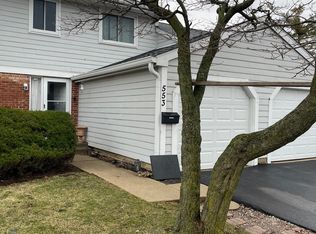
1512 McKool Ave, Streamwood, IL 60107
Off Market
Zillow last checked: 7 hours ago
Listing updated: April 01, 2026 at 10:06pm
Elizabeth Philip 847-915-5566,
Coldwell Banker Realty
Not available
Estimated sales range
Not available
Not available
| Date | Event | Price |
|---|---|---|
| 4/9/2026 | Listed for rent | $2,675+27.4%$2/sqft |
Source: Zillow Rentals Report a problem | ||
| 3/27/2026 | Price change | $269,000-2.2%$245/sqft |
Source: | ||
| 3/4/2026 | Price change | $275,000-3.5%$251/sqft |
Source: | ||
| 2/24/2026 | Listed for sale | $285,000+612.5%$260/sqft |
Source: | ||
| 3/23/2021 | Listing removed | -- |
Source: Zillow Rental Network_1 Report a problem | ||
| 2/23/2021 | Price change | $2,100+5.3%$2/sqft |
Source: Zillow Rental Network_1 Report a problem | ||
| 2/21/2021 | Listed for rent | $1,995$2/sqft |
Source: Zillow Rental Network_1 Report a problem | ||
| 10/12/2012 | Sold | $40,000-16.7%$36/sqft |
Source: | ||
| 8/9/2012 | Listed for sale | $48,000-31.3%$44/sqft |
Source: Homepath #08134122 Report a problem | ||
| 6/18/2011 | Listing removed | $69,900$64/sqft |
Source: RE/MAX United Report a problem | ||
| 4/8/2011 | Price change | $69,900+16.7%$64/sqft |
Source: RE/MAX United Report a problem | ||
| 4/2/2011 | Price change | $59,900-14.3%$55/sqft |
Source: RE/MAX United Report a problem | ||
| 2/16/2011 | Listed for sale | $69,900$64/sqft |
Source: RE/MAX United Report a problem | ||
| 1/16/2011 | Listing removed | $69,900$64/sqft |
Source: RE/MAX United Report a problem | ||
| 8/22/2010 | Listed for sale | $69,900-51.5%$64/sqft |
Source: RE/MAX United Report a problem | ||
| 10/21/2005 | Sold | $144,000+22%$131/sqft |
Source: Public Record Report a problem | ||
| 11/20/2002 | Sold | $118,000+53.2%$108/sqft |
Source: Public Record Report a problem | ||
| 11/5/1999 | Sold | $77,000+14.9%$70/sqft |
Source: Public Record Report a problem | ||
| 3/30/1995 | Sold | $67,000$61/sqft |
Source: Public Record Report a problem | ||
| Year | Property taxes | Tax assessment |
|---|---|---|
| 2023 | $4,312 +2.7% | $14,000 |
| 2022 | $4,200 +26.1% | $14,000 +53.7% |
| 2021 | $3,330 +1.7% | $9,110 |
| 2020 | $3,274 +0.1% | $9,110 -11% |
| 2019 | $3,271 +18.4% | $10,237 +30.5% |
| 2018 | $2,764 +1.4% | $7,847 |
| 2017 | $2,726 +7.2% | $7,847 |
| 2016 | $2,542 -34.6% | $7,847 -28.4% |
| 2015 | $3,888 +1.5% | $10,961 |
| 2014 | $3,829 +3.2% | $10,961 |
| 2013 | $3,710 +30.3% | $10,961 -7.4% |
| 2012 | $2,847 +4.6% | $11,841 |
| 2011 | $2,722 -1.9% | $11,841 |
| 2010 | $2,775 +9.4% | $11,841 -9.7% |
| 2009 | $2,537 +5.8% | $13,120 -7% |
| 2008 | $2,398 +3.7% | $14,107 |
| 2007 | $2,313 +7.9% | $14,107 +22.5% |
| 2006 | $2,144 -17.1% | $11,519 |
| 2005 | $2,587 +1.8% | $11,519 |
| 2004 | $2,542 +54.1% | $11,519 +61.8% |
| 2003 | $1,650 +7% | $7,118 |
| 2002 | $1,542 +5.7% | $7,118 |
| 2001 | $1,458 +49.6% | $7,118 +14.6% |
| 2000 | $975 -40% | $6,212 |
| 1999 | $1,625 | $6,212 |
Source: MRED as distributed by MLS GRID. This data may not be complete. We recommend contacting the local school district to confirm school assignments for this home.