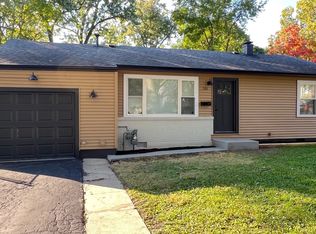
$350,100
2 bd2 ba1k sqft
415 S Dorchester Ave, Wheaton, IL 60187
Off Market
Listing description withheld by the listing agent.
Zillow last checked:
Listing updated:
Kathy Volpe, ABR,CRS,CSC,GRI,SRES 630-330-5555,
RE/MAX Suburban

Not available
Estimated sales range
Not available
Not available
| Date | Event | Price |
|---|---|---|
| 10/28/2026 | Listed for sale | $395,000+65.4%$329/sqft |
Source: MRED as distributed by MLS GRID #12790671 Report a problem | ||
| 8/9/2018 | Sold | $238,750-2.5%$199/sqft |
Source:  MRED as distributed by MLS GRID #09989200 Report a problem | ||
| 6/27/2018 | Pending sale | $244,900$204/sqft |
Source: Baird & Warner #09989200 Report a problem | ||
| 6/5/2018 | Price change | $244,900-2%$204/sqft |
Source: Baird & Warner #09989200 Report a problem | ||
| 4/26/2018 | Listed for sale | $249,900$208/sqft |
Source: Baird & Warner #09929627 Report a problem | ||
| 3/27/2018 | Pending sale | $249,900$208/sqft |
Source: Baird & Warner #09881723 Report a problem | ||
| 3/21/2018 | Price change | $249,900-2%$208/sqft |
Source: Baird & Warner #09881723 Report a problem | ||
| 3/12/2018 | Price change | $254,900-1.9%$212/sqft |
Source: Baird & Warner #09881723 Report a problem | ||
| 3/5/2018 | Price change | $259,900-3.7%$217/sqft |
Source: Baird & Warner #09881723 Report a problem | ||
| 2/23/2018 | Price change | $269,900-1.9%$225/sqft |
Source: Baird & Warner #09881723 Report a problem | ||
| 2/15/2018 | Listed for sale | $275,000+42.5%$229/sqft |
Source: Baird & Warner #09881723 Report a problem | ||
| 6/14/2013 | Sold | $193,000-2.5%$161/sqft |
Source: MRED as distributed by MLS GRID #08318243 Report a problem | ||
| 5/14/2013 | Pending sale | $198,000$165/sqft |
Source: Krain #08318243 Report a problem | ||
| 5/4/2013 | Price change | $198,000-0.5%$165/sqft |
Source: Krain #08318243 Report a problem | ||
| 4/17/2013 | Listed for sale | $199,000+99%$166/sqft |
Source: Krain #08318243 Report a problem | ||
| 3/21/2013 | Sold | $100,000-13%$83/sqft |
Source: Public Record Report a problem | ||
| 1/1/2013 | Price change | $114,900-8%$96/sqft |
Source: Prospect Equities #08114243 Report a problem | ||
| 10/17/2012 | Price change | $124,900-7.4%$104/sqft |
Source: Prospect Equities #08114243 Report a problem | ||
| 9/14/2012 | Price change | $134,900-6.9%$112/sqft |
Source: Prospect Equities #08114243 Report a problem | ||
| 8/17/2012 | Price change | $144,900-12.1%$121/sqft |
Source: Prospect Equities #08114243 Report a problem | ||
| 7/14/2012 | Listed for sale | $164,900$137/sqft |
Source: Prospect Equities #08114243 Report a problem | ||
| Year | Property taxes | Tax assessment |
|---|---|---|
| 2025 | $7,127 +2.5% | $125,655 +8.5% |
| 2024 | $6,951 +4.3% | $115,853 +8.6% |
| 2023 | $6,666 +1.6% | $106,640 +5.8% |
| 2022 | $6,564 +0.4% | $100,780 +2.4% |
| 2021 | $6,539 +0.3% | $98,390 +0.9% |
| 2020 | $6,517 +2.4% | $97,470 +2.7% |
| 2019 | $6,364 +27% | $94,900 +26.2% |
| 2018 | $5,011 +1.7% | $75,190 +3.8% |
| 2017 | $4,930 +1.5% | $72,420 +4.2% |
| 2016 | $4,856 +13.9% | $69,530 +16.8% |
| 2015 | $4,265 -4.5% | $59,510 -2.5% |
| 2014 | $4,464 +2.6% | $61,050 -0.3% |
| 2013 | $4,349 +2.2% | $61,230 -4.1% |
| 2012 | $4,257 +2.4% | $63,850 -6.4% |
| 2011 | $4,158 +1% | $68,187 -6% |
| 2010 | $4,118 +2.7% | $72,540 -3.8% |
| 2009 | $4,011 +1.8% | $75,370 |
| 2008 | $3,939 +4.1% | $75,370 +4.8% |
| 2007 | $3,786 +3.5% | $71,910 +7.5% |
| 2006 | $3,657 +4.8% | $66,890 +7.1% |
| 2005 | $3,491 +6.1% | $62,450 +7.3% |
| 2004 | $3,291 +3% | $58,200 +8.4% |
| 2003 | $3,196 +6.3% | $53,690 +6.7% |
| 2002 | $3,006 +2.9% | $50,340 +7.5% |
| 2001 | $2,921 +3.2% | $46,840 +5.1% |
| 2000 | $2,830 | $44,560 |
Source: MRED as distributed by MLS GRID. This data may not be complete. We recommend contacting the local school district to confirm school assignments for this home.


A local agent can set up tours, give advice and negotiate with sellers.
A local lender can help you make sure your offer is ready when you are.