$1,121,200
-- bd|2 ba|3.7k sqft
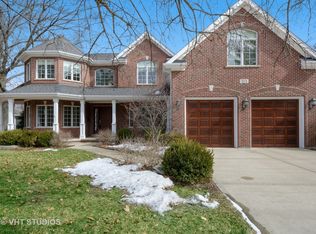
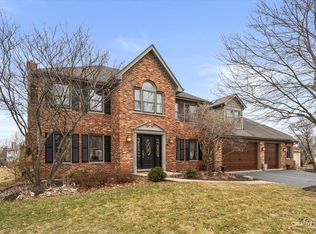
1003 James Ct, Wheaton, IL 60189
Off Market
Zillow last checked: 7 hours ago
Listing updated: 12 hours ago
Jane Belongea, CSC 630-456-2020,
Fathom Realty IL LLC
Not available
Estimated sales range
Not available
Not available
| Date | Event | Price |
|---|---|---|
| 3/12/2026 | Listed for sale | $939,000+46.5%$286/sqft |
Source: | ||
| 8/14/2020 | Sold | $640,750-1.4%$195/sqft |
Source: | ||
| 6/8/2020 | Pending sale | $650,000$198/sqft |
Source: Keller Williams Premiere Properties #10697011 Report a problem | ||
| 5/22/2020 | Price change | $650,000-3.7%$198/sqft |
Source: Keller Williams Premiere Properties #10697011 Report a problem | ||
| 4/24/2020 | Listed for sale | $675,000+237.5%$206/sqft |
Source: Keller Williams Premiere Properties #10697011 Report a problem | ||
| 11/23/2010 | Sold | $200,000-20%$61/sqft |
Source: | ||
| 10/28/2010 | Price change | $249,900-7.4%$76/sqft |
Source: RE/MAX Suburban #07610012 Report a problem | ||
| 10/11/2010 | Price change | $269,900-22.9%$82/sqft |
Source: RE/MAX Suburban #07610012 Report a problem | ||
| 8/21/2010 | Listed for sale | $349,900$107/sqft |
Source: RE/MAX Suburban #07610012 Report a problem | ||
| Year | Property taxes | Tax assessment |
|---|---|---|
| 2024 | $15,331 +4.2% | $253,859 +8.6% |
| 2023 | $14,710 +1.2% | $233,670 +5.8% |
| 2022 | $14,532 +0.4% | $220,830 +2.4% |
| 2021 | $14,480 -10.4% | $215,590 -7.4% |
| 2020 | $16,167 +2.3% | $232,910 +2.7% |
| 2019 | $15,805 +43.7% | $226,770 +24% |
| 2018 | $10,996 +2.1% | $182,820 +3.8% |
| 2017 | $10,767 +2% | $176,070 +4.2% |
| 2016 | $10,551 +12.8% | $169,040 +13.9% |
| 2015 | $9,356 +90.8% | $148,390 +123.2% |
| 2014 | $4,903 +2.6% | $66,470 -0.3% |
| 2013 | $4,778 +7% | $66,670 |
| 2012 | $4,464 +10% | $66,670 |
| 2011 | $4,057 -30.6% | $66,670 -33.6% |
| 2010 | $5,845 +174.7% | $100,440 -3.7% |
| 2009 | $2,127 +1.2% | $104,350 |
| 2008 | $2,102 -59.2% | $104,350 +4.8% |
| 2007 | $5,153 +6% | $99,570 +9.7% |
| 2006 | $4,861 +106.2% | $90,760 +7.1% |
| 2005 | $2,357 -46.3% | $84,740 +7.3% |
| 2004 | $4,390 +2.4% | $78,970 +8.4% |
| 2003 | $4,289 +7.8% | $72,850 +8% |
| 2002 | $3,977 +3% | $67,470 +7.5% |
| 2001 | $3,860 +3.3% | $62,770 +5.1% |
| 2000 | $3,737 | $59,720 |
Source: MRED as distributed by MLS GRID. This data may not be complete. We recommend contacting the local school district to confirm school assignments for this home.