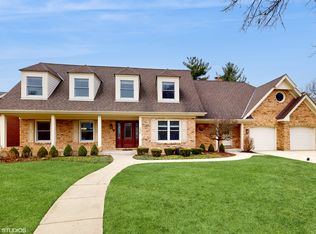
$1,741,000
5 bd|6 ba|5k sqft
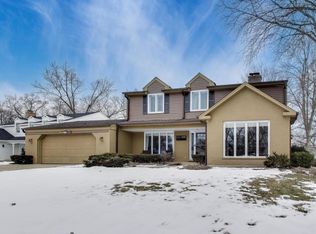
2S309 Burning Trl, Wheaton, IL 60189
Off Market
Zillow last checked: 7 hours ago
Listing updated: 11 hours ago
Yvonne Rusin, CNC 630-886-5841,
Coldwell Banker Realty
Not available
Estimated sales range
Not available
Not available
| Date | Event | Price |
|---|---|---|
| 3/19/2026 | Listed for sale | $849,900+49.1%$250/sqft |
Source: | ||
| 8/2/2017 | Sold | $570,000-0.9%$167/sqft |
Source: | ||
| 7/7/2017 | Pending sale | $575,000$169/sqft |
Source: Berkshire Hathaway HomeServices KoenigRubloff #09637265 Report a problem | ||
| 6/7/2017 | Price change | $575,000-1.7%$169/sqft |
Source: Berkshire Hathaway HomeServices KoenigRubloff Realty Group #09637265 Report a problem | ||
| 5/24/2017 | Listed for sale | $585,000+3.7%$172/sqft |
Source: Berkshire Hathaway HomeServices KoenigRubloff #09637265 Report a problem | ||
| 5/23/2016 | Sold | $564,000-1.9%$166/sqft |
Source: | ||
| 3/31/2016 | Pending sale | $574,900$169/sqft |
Source: Realstar Realty Inc #09133637 Report a problem | ||
| 3/19/2016 | Price change | $574,900-4.2%$169/sqft |
Source: Realstar Realty Inc #09133637 Report a problem | ||
| 10/6/2015 | Price change | $599,900-7.7%$176/sqft |
Source: Realstar Realty Inc #09133637 Report a problem | ||
| 7/23/2015 | Listed for sale | $649,900+180.1%$191/sqft |
Source: Realstar Realty Inc #09133637 Report a problem | ||
| 10/21/1996 | Sold | $232,000$68/sqft |
Source: Public Record Report a problem | ||
| Year | Property taxes | Tax assessment |
|---|---|---|
| 2024 | $13,085 +4.4% | $232,142 +8.6% |
| 2023 | $12,537 +3.3% | $213,680 +5.8% |
| 2022 | $12,133 +3.2% | $201,940 +2.4% |
| 2021 | $11,754 +0.9% | $197,150 +0.9% |
| 2020 | $11,649 +2.6% | $195,320 +2.7% |
| 2019 | $11,352 -4% | $190,160 -4.4% |
| 2018 | $11,824 +1.6% | $198,920 +3.8% |
| 2017 | $11,632 +1.3% | $191,580 +4.2% |
| 2016 | $11,488 +0.7% | $183,930 +4.8% |
| 2015 | $11,410 +24.3% | $175,470 +25.6% |
| 2014 | $9,176 +3.1% | $139,660 -0.3% |
| 2013 | $8,903 +4.2% | $140,080 -3.1% |
| 2012 | $8,546 +3.2% | $144,500 -6.4% |
| 2011 | $8,277 +1% | $154,331 -6.5% |
| 2010 | $8,193 +3.3% | $165,060 -3.7% |
| 2009 | $7,932 +1.4% | $171,490 |
| 2008 | $7,820 +4.4% | $171,490 +4.8% |
| 2007 | $7,490 +18.4% | $163,630 +22.5% |
| 2006 | $6,327 +4.5% | $133,600 +7.1% |
| 2005 | $6,054 +4% | $124,750 +7.3% |
| 2004 | $5,821 +0.2% | $116,260 +5.6% |
| 2003 | $5,809 +11.1% | $110,090 +11.8% |
| 2002 | $5,231 +3.6% | $98,430 +7.5% |
| 2001 | $5,048 +2.9% | $91,560 +5.1% |
| 2000 | $4,906 | $87,110 |
Source: MRED as distributed by MLS GRID. This data may not be complete. We recommend contacting the local school district to confirm school assignments for this home.