$70,870
6 bd|6 ba|6.2k sqft
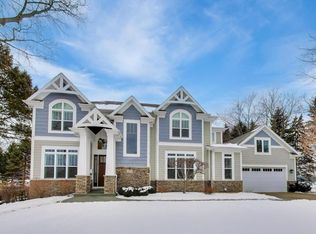
511 Pinecrest Ln, Wilmette, IL 60091
Off Market

Likely to sell faster than
Zillow last checked: 8 hours ago
Listing updated: March 01, 2026 at 02:01pm
Paige Dooley 847-446-9600,
Compass,
Hannah Burque 847-431-3805,
Compass
$1,374,400
$1.31M - $1.44M
$7,218/mo
| Date | Event | Price |
|---|---|---|
| 3/1/2026 | Listed for sale | $1,395,000+32.2%$311/sqft |
Source: | ||
| 6/25/2018 | Sold | $1,055,000-5.8%$236/sqft |
Source: | ||
| 5/1/2018 | Pending sale | $1,120,000$250/sqft |
Source: Coldwell Banker Residential Brokerage - Glencoe #09905916 Report a problem | ||
| 4/2/2018 | Listed for sale | $1,120,000$250/sqft |
Source: Coldwell Banker Residential #09901857 Report a problem | ||
| 11/17/2017 | Listing removed | $1,120,000$250/sqft |
Source: Coldwell Banker Residential Brokerage - Glencoe #09709256 Report a problem | ||
| 9/21/2017 | Price change | $1,120,000-2.2%$250/sqft |
Source: Coldwell Banker Residential Brokerage - Glencoe #09709256 Report a problem | ||
| 6/19/2017 | Listed for sale | $1,145,000-2.6%$256/sqft |
Source: Berkshire Hathaway HomeServices KoenigRubloff #09663762 Report a problem | ||
| 10/7/2014 | Listing removed | $1,175,000$262/sqft |
Source: @properties #08646515 Report a problem | ||
| 3/4/2014 | Listed for sale | $1,175,000$262/sqft |
Source: @properties #08646515 Report a problem | ||
| 11/26/2013 | Listing removed | $1,175,000$262/sqft |
Source: @properties #08488716 Report a problem | ||
| 10/9/2013 | Listed for sale | $1,175,000$262/sqft |
Source: Prudential Rubloff #08462056 Report a problem | ||
| Year | Property taxes | Tax assessment |
|---|---|---|
| 2023 | $19,071 -15.9% | $87,359 -19.9% |
| 2022 | $22,676 +3.6% | $109,000 +24.4% |
| 2021 | $21,895 -4.3% | $87,610 -5.4% |
| 2020 | $22,869 +2% | $92,590 -9% |
| 2019 | $22,428 +26.6% | $101,748 +30.6% |
| 2018 | $17,716 +2.8% | $77,901 |
| 2017 | $17,240 -0.4% | $77,901 -5.2% |
| 2016 | $17,315 +23.8% | $82,156 +39.4% |
| 2015 | $13,981 +1.5% | $58,943 |
| 2014 | $13,772 +4.8% | $58,943 |
| 2013 | $13,138 -12.5% | $58,943 -19.9% |
| 2012 | $15,020 +6.8% | $73,560 |
| 2011 | $14,061 +3.9% | $73,560 |
| 2010 | $13,534 -7.1% | $73,560 -20.3% |
| 2009 | $14,566 +6.6% | $92,340 -5% |
| 2008 | $13,661 +5.8% | $97,200 |
| 2007 | $12,916 +58.6% | $97,200 +89.3% |
| 2006 | $8,144 +8.7% | $51,348 |
| 2005 | $7,490 +2.5% | $51,348 |
| 2004 | $7,310 -5.4% | $51,348 +17.5% |
| 2003 | $7,724 0% | $43,710 |
| 2002 | $7,725 +85% | $43,710 +48.5% |
| 2001 | $4,176 +4.3% | $29,429 +25.6% |
| 2000 | $4,004 +3.6% | $23,439 |
| 1999 | $3,864 | $23,439 |
Source: MRED as distributed by MLS GRID. This data may not be complete. We recommend contacting the local school district to confirm school assignments for this home.